Title: The age structure of the Milky Way’s halo
Authors: D. Carollo, T. Beers, V. Placco et al.
First author’s institution: Department of Physics, University of Notre Dame, USA
Status: accepted for publication on Nature Physics
How has our Galaxy been formed? How did it evolve to its current structure? Surprisingly or not, these apparent simple questions have no definite answers yet. We are getting closer to answering them, thanks to the large increase in available photometric and spectroscopic data obtained by recent large-scale surveys such as the Sloan Digital Sky Survey (SDSS), the Radial Velocity Experiment (RAVE) and the Gaia-ESO Survey (GES). However, there’s probably still a long way to go. We can tell the Milky Way has a central bulge, a disk and a halo, but the more we look, the more complex these structures seem to be (some examples here and there). The authors of today’s paper used available survey data to study our Galaxy’s halo and confirmed that it doesn’t escape this rule.
What took us so long?
Apart from streams resulting from the Milky Way accreting nearby dwarf galaxies, you’ve probably heard that there isn’t much going on in the halo. It’s big, it’s old and that’s pretty much it. Except that it isn’t. The problem is that, until only recently, it was a near impossible task to estimate ages of individual stellar populations. From the spectroscopic data provided by surveys, we can estimate radial velocities and stellar atmospheric parameters, namely effective temperature, surface gravity and chemical abundances. That allows us to derive kinematics and chemical constraints on the different structures and populations of the Milky Way. Unfortunately, because the age cannot be properly determined from those parameters, there are still some unanswered questions.
For the bulge, some crude age information can be inferred from comparison with population-synthesis models. This technique links observations and theory by simulating a stellar population evolving from its birth to the current observational state, allowing us to infer the population’s age, among other properties. The disk on the other hand can be studied through its variable stars, to which asteroseismology can provide good age estimates. The halo so far has been studied by modelling colour-magnitude diagrams of globular clusters. The results motivated models suggesting a hierarchical assembly model of the galaxy, in place of the simple rapid monolithic collapse model. The former model claims that the Galaxy was built from mergers of smaller stellar systems, while the latter suggests it was formed from the collapse of a huge gas cloud. More recent and precise studies indicated that globular clusters closer to the Galactic Centre are older than the ones located farther away, favouring the hierarchical assembly model. Still, we couldn’t verify this pattern for field stars, since their ages couldn’t be determined.
The ultimate step: obtaining ages for blue horizontal-branch stars
To overcome this obstacle, the authors made use of a technique developed a quarter-century ago. It suggested that the ages of the stellar populations in the halo of the Milky Way can be estimated from the colours of a class of field stars known as blue horizontal-branch (BHB) stars. These stars are less massive than the Sun, but much older. They have already burned all the available hydrogen in their cores, left the main sequence, and are currently burning helium in their cores. Their luminosity is close to constant, so on the H-R diagram they lie on an almost horizontal line, hence the name. The mean metallicity of BHB stars in the halo was also found to be almost constant, implying that their colours depend basically on their mass: a less-massive BHB star has a bluer colour, because it must have a higher temperature to keep the same luminosity as a more-massive BHB star. As it takes longer to a low-mass star to reach the BHB, older stars have lower initial masses than younger stars, so the mass-colour relation leads to an age-colour relation.
To calculate this age-colour relation, the authors used a horizontal-branch stellar population synthesis tool that provides the age shift as a function of the mean g-r colour shift, where g and r are the magnitudes in these SDSS filters. The zero point was set to 13.5 Gyr, consistent with the inferred age of the oldest star with a reliable age determination. The authors applied this technique to hundreds of thousands colour-selected BHB stars from the SDSS. With these stars, they made a high-resolution age map of the Milky Way’s halo, extending to 60 kpc from the Galactic Centre. For that, they divided the space in a grid of 1 kpc square pixels and obtained the mean colours for the stars in each pixel. With their age-colour relation, they attributed an age to each pixel, resulting on the cool plots shown on Fig. 1.
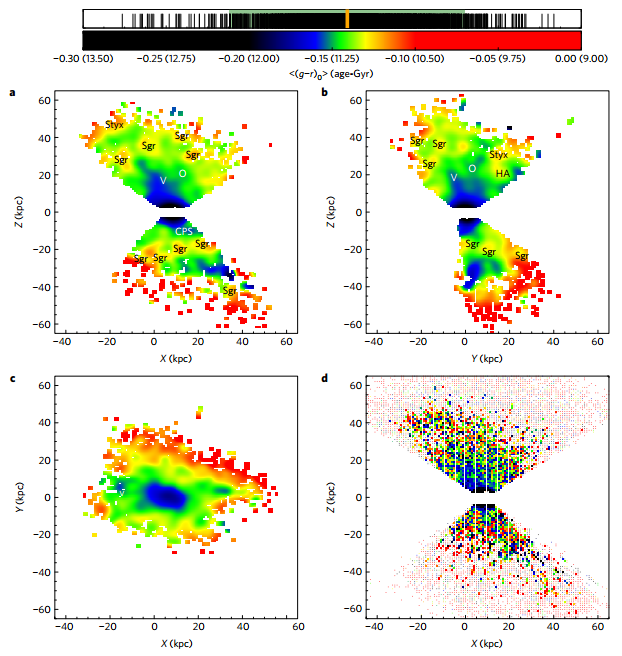
Figure 1: Age maps for BHB colour-selected stars from the SDSS. A Cartesian reference system is adopted, with the centre of the Galaxy at (0,0,0) and the Sun at (8.5,0,0) kpc. The colour (age) scale is shown at the top, with the numbers in parentheses corresponding to age in billions of years. The orange bar is the median value for all pixels and the green-shaded area indicates the 2-sigma dispersion region. In panels (a), (b) and (c), the distributions in the (X,Z), (Y,Z) and (X,Y) are shown, respectively, smoothing the square grid of 1 kpc pixels with a Gaussian kernel with 3 kpc of width. Previously known structures and over-densities are marked as: Sgr, Sagittarius Stream; V, Virgo over-density; O, Orphan Stream; Styx, Styx Stream; CPS, Cetus Polar Stream; HA, Hercules-Aquila cloud. Panel (d) shows the distribution in the (X,Z) plane without the smoothing. Filled squares are the pixels taken into account for the analysis, because they show at least 10 stars. The filled dots are neglected pixels, with less than 10 stars. The two-triangle shape reflects the selection of stars in Galactic latitude (|b|>35°).
What’s cool about it?
One thing that catches the eye on Fig. 1 is the fact that we can easily spot known streams and overdensities, such as the Sagittarius Stream. This serves to reinforce that the authors technique is reliable: known results are reproduced. More than that, they also seem to have found some unknown structures, but that’s a history they leave to another occasion. Their point here is: the central regions of their maps, up to 10-15 kpc, show a clear concentration of very old stars (11-12.5 Gyr), while outside this region the halo is dominated by younger stellar populations, with average ages of 11 Gyr.
They noted that, as we get farther away from the plane, the number of younger stars gradually increases, moving the median age towards lower values as Z increases. This agrees with the result obtained from globular clusters mentioned above. Moreover, the dispersion in age is also increasing with distance from the Galactic plane. This suggests that, as we go outward from the Galactic Centre, the number of younger structures progressively increases while the number of oldest stars remains constant at all distances. Fig. 2 shows this trend, summarising the variations in the mean ages of halo stars with distances in the vertical (Z) and radial directions (R).
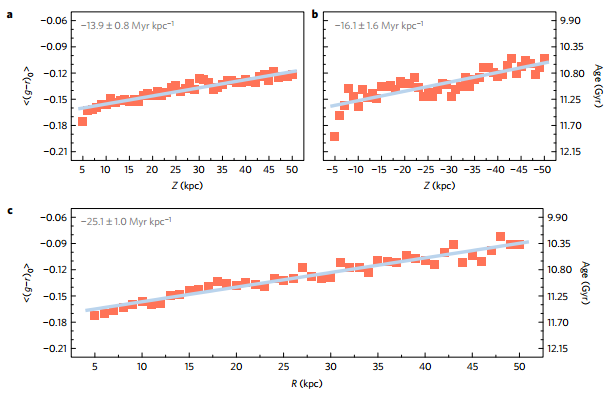
Figure 2: Colour/age gradient in the vertical (Z) and radial (R) distance directions. The red squares show the mean colours for each 1 kpc bin and the grey line is a linear fit to the data. The right y-axis shows the mean age. Panels (a) and (b) show the colour/age gradients above and below the Galactic plane, respectively. It’s easy to note that the stellar populations become progressively younger with distance from the Galactic plane. Panel (c) shows the gradient over radial Galactocentric distance, and the same trend can be spotted. The numbers shown on the top-left of each plot are the fitted slopes, with the obtained standard deviation.
This multiplicity of populations in the halos of galaxies, which are referred to as diffuse inner- and outer-halo populations, is a feature already identified in current numerical simulations of galaxy formation. The inner-halo population probably formed from more massive-halos, which assembled first, or in situ from the collapse of infalling gas. The outer-halo population, on the other hand, formed in lower-mass dwarf galaxies, that were disrupted and accreted by the main halo. This observational work confirms that: younger structures dominate the outer-halo, probably being explained by late-term merging events.
Using a technique that was long known, the authors of today’s paper confirmed something that was only hinted at: our halo gets younger as the distance from the Galactic Centre increases. This hints that there was much more going on on the outer-halo regions in the last billion years that we initially suspected. The technique is still being improved, because metallicity has an effect on the zero point of the age-colour relation, despite not affecting its slope, and the authors didn’t take that into account. This improvement could allow us to analyse in more the detail the age structure of over-densities, debris stream and even the satellite dwarf galaxies of the Milky Way. So more exciting results should be on their way!
Author