Title: The Sloan Digital Sky Survey: Technical Summary
Authors: Donald G. York, J. Adelman, John E. Anderson, Jr., et al.
First Author’s Institution: Department of Astronomy and Astrophysics, University of Chicago, USA
Status: Submitted to The Astronomical Journal [open access]
The story today begins with the Princeton astronomer James Gunn, who in the 1980s was well aware of the advancements in optical detector technologies and processing power in computers that could analyse gigabytes of data. Gunn, who was famous for predicting the Gunn-Peterson trough in the spectra of distant quasars, dreamt of a next generation telescope that would point to the sky and look at the ensemble of objects that adorn it – the cosmic web of galaxies! This dream would bring together physicists, engineers, computer scientists and astrophysicists in a rapidly changing community to create a legacy that was going to change the field as we knew it.
The product? The Sloan Digital Sky Survey.

The 2.5m SDSS Telescope at APO, New Mexico, US.
SDSS has been an integral part of the reshaping of astrophysics in the last two decades. Today’s astrophysicists are embracing the challenge of simultaneously appreciating all elements of research in astrophysics – from data structures to modern engineering, from servers hosting n-body simulations to groundbreaking phenomenological studies. It can safely be said that SDSS was a pioneer project that enabled astrophysicists to do exactly that – look at the universe at the grandest scale with unlimited potential and possibilities.
From the support of the Alfred P. Sloan foundation and various agencies in the US and beyond, SDSS materialized into a project in the early 1990s, and saw first light in 1999 as part of a commissioning phase. This 2.5-m wide-angle optical telescope at Apache Point Observatory in New Mexico, USA started its data run in 2000, taking spectra and images of about 35% of the night sky, with 3 million spectra and 500 million images coming together to form the most comprehensive astrophysical catalog in the world. This catalog contains millions of galaxies upto z = 1, bright quasars upto z=6, with images in five major filter bands – u,g,r,i and z.
SDSS was divided into multiple surveys/projects :
- SDSS I (2000-2005)
- SDSS II (2005-2008), including the Sloan Supernova Survey
- SDSS III (2008-2014), including the APO Galactic Evolution Experiment (APOGEE), Baryon Oscillation Spectroscopic Survey (BOSS)
- SDSS IV (2014-2020), including the Mapping Nearby Galaxies at APO (MaNGA)
Today’s widely cited paper was the first technical summary of the project with discussions on survey characteristics and early science data.
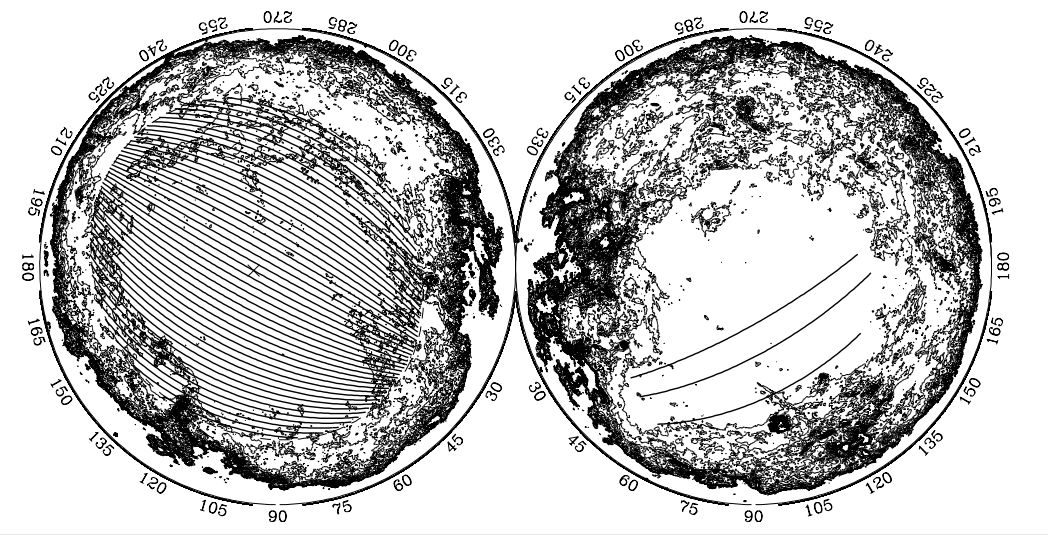
Sky projection in Galactic coordinates, of the northern (left) and southern (right – three stripes) SDSS surveys.
The Survey
The telescope has different modes – imaging and spectroscopic. The imaging detectors are CCD-based, SDSS being one of the first major telescopes to ever use them. The rough resolution of the camera is ~0.4″, with the camera sweeping the sky in great circles in all five filters i.e. each point in the sky is seen by the camera 5 times. The dimmest objects that the initial cameras were expected to see were of AB magnitude ~23 in the g,r bands. The imaging survey at the time of initiation was planned to cover 10,000 square degrees of the northern Galactic cap, along with three stripes in the southern Galactic cap.
Once objects were detected and stored by SDSS, extended objects were identified and classified as galaxies. The galaxy candidates then became part of the sample whose spectra were taken. Strong absorption lines in red galaxies and brightest cluster galaxies were targeted for measuring redshifts. This enabled SDSS to create a 3-D map of the universe up to a certain sensitivity limit, with a mean redshift of z~0.2-0.3. About 650 spectra were taken at a time, with spectroscopic masks being designed based on the imaging surveys. Moreover, this was one of the first projects to implement photometric redshift calculations of objects beyond z=0.2, because of the efficient characterization of its filters and the sheer amount of data that SDSS would generate!
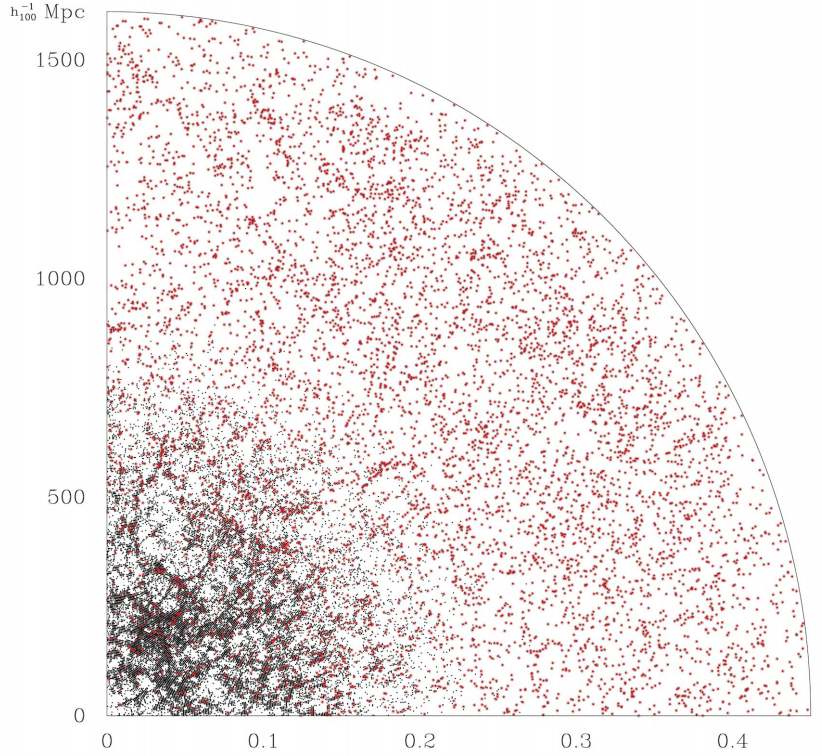
This is a simulated galaxy distribution in a 6 degree slice of the SDSS. Small dots are the main galaxy sample, the redder dots are a special sample of luminous red galaxies.
Early Science, circa 2000
As mentioned before, the fundamental focus of this survey – whose data is still extremely relevant and competitively analysed, 17 years later – was to characterize the largest structures in the universe. This could be the largest galaxy clusters, or the cosmic filamentary structures predicted in cosmological simulations. Using photometric redshifts, statistics of large datasets and efficient reddening correction for galaxies, the SDSS collaboration planned to take about 2000 square degrees worth of test data and about 20,000 spectra (in the year 2000!). Weak lensing of background galaxies by foreground objects had already been detected, and a 150 RR Lyrae stars (which had never been seen before in the Galactic Halo) had been identified.
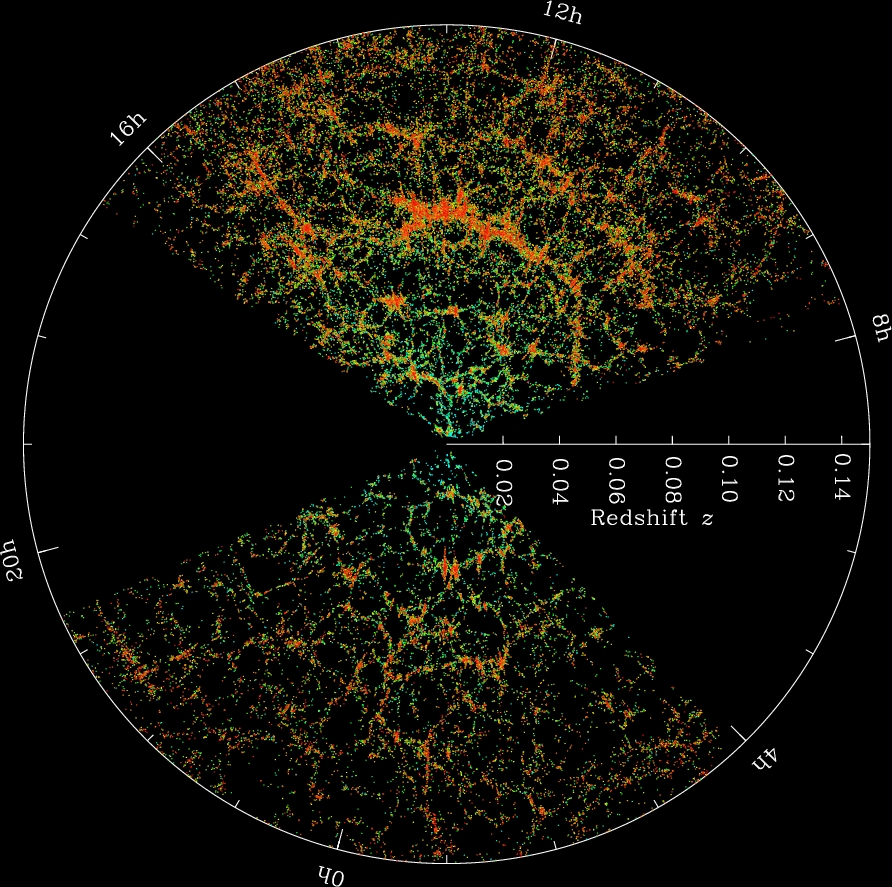
An updated 3-d map of the local universe (z~0.15), constructed using SDSS spectra that inform us of a galaxy’s redshift. The filamentary structures of the cosmic web can be clearly seen.
As all SDSS data is residing in public archives, it is being extensively used by the community for research and teaching. The World Wide Telescope uses SDSS images for its characterization of the night sky. On the other hand, citizen science projects like Galaxy Zoo employ astronomy enthusiasts who help classify millions of galaxies in the SDSS data and churn out good science, from their homes! The future looks promising. The Dark Energy Survey (DES), the Large Synoptic Survey Telescope (LSST) and the Dark Energy Spectroscopic Instrument(DESI) are worthy successors that will take billions of images and spectra, with petabytes of data left to be analysed by the next generation of astronomers. It’s interesting to note that several bites on our website every month are about SDSS data and analysis, which makes this ‘beyond’ bite our way of paying homage to this amazing telescope.
Author
Trackbacks/Pingbacks