Title: Gas Cooling in Hydrodynamic Simulations with An Exact Time Integration Scheme
Authors: Qirong Zhu, Britton Smith, Lars Hernquist
First Author’s Institution: Department of Astronomy & Astrophysics; Institute for Cosmology and Gravity, The Pennsylvania State University, PA 16802, USA
Status: Accepted to the Monthly Notices of the Royal Astronomical Society, open access
We astrophysicists should give thanks to our computers for making our groundbreaking endeavors possible. Without them, we wouldn’t be able to operate telescopes in space, mine gigantic observational datasets, or even simulate the whole Universe from nearly nothing! As it turns out, we are doing a pretty good job at simulating the Universe on computers. For example, in the recent Illustris simulation, we have successfully reproduced the observed structures of galaxies based on initial conditions shortly after the Big Bang. Simulations that aim to study the formation of large-scale structures (e.g. galaxies, clusters of galaxies) of the Universe are known as cosmological simulations, and the ones that include also the motions of baryons (e.g. gas, stars, black holes) are called hydrodynamic simulations.
Despite the success, we have to constantly remind ourselves not to be complacent about our achievements. Earlier we have reflected on the general approach of simulations in astrophysics. Today’s paper concerns a rather technical aspect of hydrodynamic simulations – the way gas cooling is followed numerically. Since stars and galaxies owe their existence to gravitational collapses of gas clouds, and the collapses would not sustain without the gas being efficiently cooled, gas cooling plays a key role in the study of galaxy formation.
Given an initial gas temperature, an accurate gas cooling scheme gives a reliable forecast of the future temperature evolution in discrete time steps. A time step is the time interval between successive temperature predictions. Typically, the prediction is handled by an explicit scheme or an implicit one. The explicit scheme assumes the gas cools at the same initial rate throughout the time step. It is very easy to code, but the time steps have to be sufficiently small in order for the scheme to be stable (not giving unphysical temperature fluctuations). The implicit scheme expresses the cooling rate at the end of the time step, which in itself depends on temperature we are solving for. This extra layer of complexity offers the implicit scheme numerical stability even with large time steps, but the required coding is much more involved.
Both the explicit and implicit schemes are general methods commonly used in most numerical calculations, but the authors of today’s paper take an entirely different approach to this problem. Utilizing our extensive understanding of gas behavior at different temperatures and densities, also known as the ‘gas cooling function’, the authors demonstrate that we can solve the temperature evolution of gas exactly! After some verification tests of this exact gas cooling scheme, they apply it to an actual simulation to observe its effects.
The target simulation is a cosmological hydrodynamic simulation following the assembly of the Universe, wherein the authors employ the exact scheme. For those who are interested in the technical aspects of the exact scheme, the full implementation can be found here. The authors then compare the results from the explicit scheme represented by the GRACKLE code, and the implicit scheme represented by the GADGET code.
Figure 1 shows the side-by-side comparison of the gas density distribution from all three schemes, color-coded to show cold (hot) gas in blue (yellow). It’s not hard for me to convince you that the density and temperature distributions look almost identical. The most prominent features in the images are the low-density voids and the shock-heated regions (caused by fast-moving gas running into slow-moving gas). Both of these don’t have sharp changes in temperature, and it is not surprising that the cooling scheme only has a minor impact.
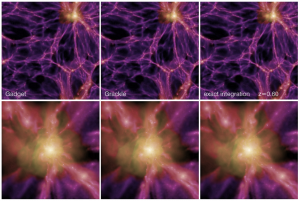
Figure 1. Gas density distribution snapshots taken at redshift of 0.6 in the simulations. The left, middle, and the right panels correspond to the implicit, explicit, and the exact scheme respectively. The lower panels show the zoomed-in view of the most massive dark matter halo.
To have a closer look at the precise differences between the three schemes, let’s take a look at the density-temperature phase diagrams from the simulations in Figure 2. Phase diagrams are the bread-and-butter for astrophysicists studying star formation – they help visualize the distribution of gas at different densities and temperatures, with the pixel color representing the amount of gas. In the diagrams, red pixels mean a lot of gas, while blue ones mean only a small fraction in that particular state.
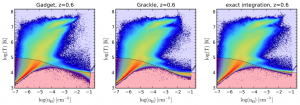
Figure 2. Gas density-temperature phase diagrams taken at redshift of 0.6 for the three cooling schemes. The red (blue) shade shows the region where gas is subject to net heating (cooling), the dividing grey line marks where heating and cooling are in equilibrium.
Overall, the phase diagrams agree well across most of the parameter space. However, if you look closer, you can see that the temperature of the high-density tail (with density between 10-2 and 10-1 cm-3) is slight higher with the exact scheme. While the temperature obtained from the exact scheme closely follows the equilibrium value (grey line), both the explicit and implicit schemes show clear biases towards lower temperatures. Physically, this tail corresponds to the gas falling towards the center of the early-galaxy centers along the gas filaments (the red-purple structures in Figure 1), the gas supply for star formation.
The cooling efficiency of gas and star formation activity go hand in hand. With the slightly less efficient cooling, the authors find that the exact scheme produces the least amount of stars among the three gas cooling schemes, about 10% fewer than the explicit and implicit schemes. Accurately predicting the amount of stars is the holy grail of galaxy formation study (we even train computers to help out), and this finding is therefore an important one. It may help explain the inefficient star formation and alleviate the need for stellar feedback. The authors also demonstrate that the accuracy of the exact scheme does not compromise runtime efficiency of the code, so the new scheme can be adopted for many more sophisticated applications.

Trackbacks/Pingbacks