Title: The Evolutionary Sequence of Post-Starburst Galaxies
Authors: C. L. Wilkinson, K. A. Pimbblet, J. P. Stott
First Author’s Institution: E. A. Milne Centre for Astrophysics, University of Hull, Cottingham Road, Kingston Upon Hull, HU6 7RX, UK
Status: Accepted in MNRAS [open access]
Spanning eons in a single image
If you’ve ever spared a quick, casual glance at the night sky, you may have noticed a few bright stars, sparkling bravely alongside the Moon. But if you look long enough and deep enough, you’ll notice that there’s a lot more out there than just a few twinkling stars. Figure 1 shows a beautiful snapshot of the Hubble Ultra Deep Field, where we can see not just stars but galaxies – nearly 10,000 of them! – across an area that’s only about one-tenth the length of the full Moon. The galaxies that we see come in all sorts of shapes, sizes, ages, and colors, but astronomers, like the authors of today’s astrobite, believe that there are similarities and patterns in how each of these galaxies grow and evolve.
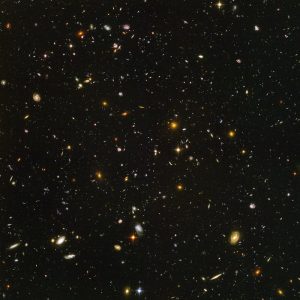
Figure 1: An image of the Hubble Ultra Deep Field, courtesy of the Hubble telescope. We can see nearly 10,000 galaxies in this image, which has a size of only about one-tenth the length of the full Moon! Image Credit: NASA, ESA, and S. Beckwith (STSci) and the HUDF Team.
Confirming and testing these proposed patterns of evolution, however, is no easy task. Tracking the evolution of these galaxies in real time isn’t anywhere near as fast and exciting as, say, watching grass grow. That’s because galaxies evolve over millions and millions of years. So instead, astronomers infer how galaxies evolve using clues from observations and simulations.
One method is through color-magnitude diagrams of many, many galaxies. Color-magnitude diagrams plot a galaxy’s color against its absolute magnitude. As discussed in exquisite detail in this previous astrobite, a galaxy’s color tells us how quickly that galaxy is producing stars over time – in other words, the galaxy’s star formation rate. Bluer galaxies tend to have a higher star formation rate than redder galaxies. And a galaxy’s absolute magnitude tells us how bright, or luminous, the galaxy is. Galaxies with more stars tend to be more luminous than galaxies with fewer stars.
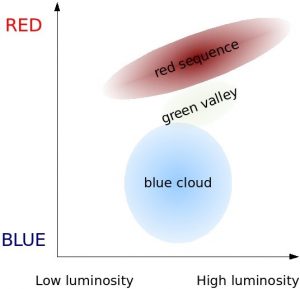
Figure 2: A simple schematic of the galaxy color-magnitude diagram. The x-axis gives the luminosity of the galaxy, increasing from left to right, which tells us information on how many stars are in the galaxy (brighter galaxies may have more stars). The y-axis is color, going upwards from blue to red, and indicates the rate at which the galaxy is producing stars (bluer galaxies may produce stars more quickly than redder galaxies). The three regions where galaxies typically reside (the blue cloud, the green valley, and the red sequence) are each labeled. Image Credit: “Galaxy Color-Magnitude Diagram”, Wikimedia Commons.
Figure 2 gives a very simple schematic of a galaxy color-magnitude diagram. From observations of many, many galaxies, astronomers have noticed that galaxies typically fall within three major ranges: the red sequence, the green valley, and the blue cloud. Galaxies in the blue cloud tend to be forming a lot of fresh new stars, while galaxies in the red sequence are usually not actively forming stars at all. The green valley acts like a transition between the two regions, and is a lot more sparsely populated.
One theory of galaxy evolution figures that galaxies evolve from near the blue cloud, up through the green valley, and into the red sequence over time. But in practice, galaxies don’t always lie so nicely on a straight line from one point on the diagram to another.
From red to blue and back again
Today’s authors explored one type of galaxy that has been a bit of an oddball on the color-magnitude diagram: the E+A galaxy. E+A galaxies are post-starburst galaxies, which means that the galaxies were once producing stars at a relatively high rate earlier in their lifetimes, but have since calmed down. These galaxies are elliptical (meaning that they are shaped like 3D ellipses), and have an abundance of young A-class stars (which, on average, are about 80 times brighter than our Sun). These galaxies seem to be a crucial link between spiral-shaped galaxies forming stars in their midst and elliptical galaxies no longer forming stars.
Previous groups of astronomers have plotted E+A galaxies on the color-magnitude diagram – and found that the galaxies land in different regions! One research group, for instance, found that most E+A galaxies are in the blue cloud. Another research group, however, saw that E+A galaxies end up at the redder side of the blue cloud, and merge into the green valley. And yet another research group noted that E+A galaxies are in the bluer side of the red sequence, and merge into the green valley from there!
So how is it that these E+A galaxies have ended up in so many different places on the color-magnitude diagram? This was one of the questions that today’s authors set out to answer. They wondered if these differences come from differences in the methods used to classify E+A galaxies themselves.
Shedding some light on the situation
Astronomers can classify galaxies using their spectra. A spectrum is the light that an object (such as a star, or an overall galaxy) gives off as a function of wavelength. As described in this previous astrobite, spectra can have absorption features, which look like dips in the spectra, as well as emission features, which look like steep peaks. The sort of absorption and emission features that a galaxy spectrum has can give us insight into the galaxy’s composition.
The authors note that many research groups have classified a galaxy as an E+A galaxy if its spectrum has no [OII] (aka, ionized oxygen, which emits at a wavelength of 3727 Angstroms) emission, but does have strong H-delta absorption. That’s because a lack of [OII] emission implies that the galaxy is no longer undergoing star formation, while strong H-delta absorption is an indication that the galaxy likely has fresh new A-class stars in its midst. Other research groups, however, also require that a galaxy lack H-alpha emission to be an E+A galaxy. A lack of H-alpha emission is another, trickier pointer towards no star formation.
Today’s authors theorized that these different ways of classifying E+A galaxies might be the cause of their staggering spread across the color-magnitude diagram. To test this theory, the authors explored a sample of over 190 galaxies split into three groups:
- “H-delta strong”: Galaxies with strong H-delta absorption
- “General E+A”: Galaxies with strong H-delta absorption and a lack of [OII] emission
- “Pure E+A”: Galaxies with strong H-delta absorption and a lack of [OII] emission and a lack of H-alpha emission
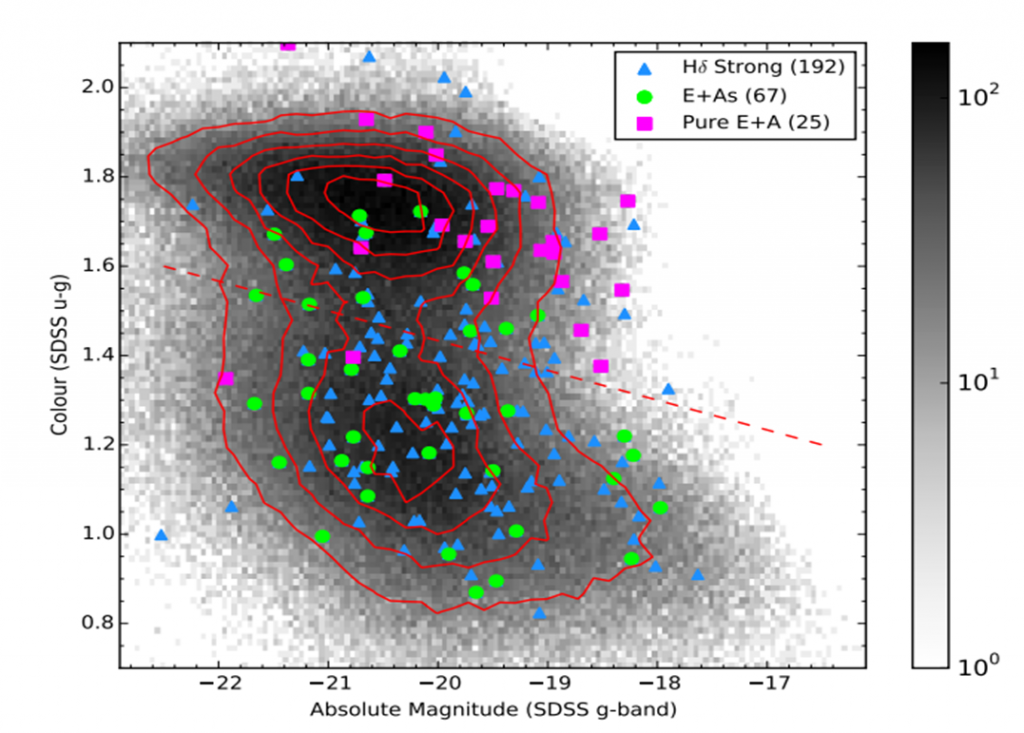
Figure 3: A color-magnitude diagram of the three groups that the authors considered. The x-axis is absolute magnitude, which indicates galaxy brightness (brightness increases from right to left). The y-axis is color (going upwards from blue to red). Each blue triangle is an H-delta strong galaxy, each green circle is a general E+A galaxy, and each pink square is a pure E+A galaxy from their sample. The background grays represent galaxies plotted from a dataset known as SDSS DR7. The red contours outline the red sequence and the blue cloud regions based on the SDSS DR7 data, while the dashed red line separates the two regions. Figure 4 in the paper.
Figure 3 illustrates a plot of these three different groups on a color-magnitude diagram. The authors discovered that the majority of the pure E+A galaxies lie neatly in the red sequence. All-together, the H-delta strong and general E+A galaxies fall more towards the blue cloud. The H-delta strong galaxies peak in the blue cloud, while the general E+A galaxies peak in the green valley.
The authors also examined how the shape and environment of the galaxies varied across these three groups. They concluded that these three groups of galaxies, rather than being instances of the same galaxy type, are perhaps actually links in their own evolutionary sequence for post-starburst galaxies! They proposed the following track: bluer H-delta strong galaxies would have some residual star formation; but over time would lose that star formation, morphing through the general E+A galaxies in the green valley towards the pure E+A galaxies sitting passively in the red sequence.
With this track, we have new links to add to the long cosmic chain of galaxy evolution. And with each long, deep look that we take of a patch of the night sky, we can make out a clearer picture of the patterns that connect those thousands of galaxies beyond our own.


Nicely written – I am forwarding your bite to some of my public school students.