Title: Star Formation Rates in Normal and Peculiar Galaxies
Authors: Richard B. Larson, Beatrice M. Tinsley
First Author’s (then) Institution: Yale Observatory
In this ongoing series, instead of summarizing a recent result from astro-ph, we will discuss a historical discovery from a paper that has become an astrophysical classic.
We’ll start our discussion by taking a trip back in time to fifty years ago…
1968
The year is 1968, and the study of galaxy evolution hasn’t really started yet.
Telescopes with CCDs don’t exist yet, so observations rely on measurements from photographic plates. The most distant galaxies we’ve observed are at a whopping redshift of z~0.3—in the future, we’ll discover that this corresponds to about 3 billion years ago, but right now we don’t know this because we don’t know much about the shape of the universe. The cosmic microwave background was only discovered last year, after all, so the era of observational cosmology has only just begun. We do know that galaxies are made of stars, but even stars aren’t well understood, especially their later evolutionary stages.
In the midst of all this confusion, a tremendously ambitious graduate student named Beatrice Tinsley comes up with a method to calculate the overall spectrum of a galaxy.
It’s a beautifully simple premise—the spectrum of a galaxy is just an average of the spectra of the stars that make up the galaxy—but it’s hellishly complicated in practice. You need to know all the things that go into stellar spectra (how stars evolve, how they make elements, how their atmospheres work), plus you need to know how to put together stellar populations (how many stars of each kind go into a galaxy), plus you need to factor in how dust and gas in a galaxy affect the light from all the stars.
And yet, Tinsley pulls it off. Tinsley’s dissertation paper describes the very first evolutionary synthesis models. They’re a bit crude, but the method she lays out will be used for decades in the future (even as far away as, say, 2018).
…But that’s not what this Astrobite is about. (If you’re interested, this is a great overview of Tinsley’s seminal 1968 paper, and the paper itself can also be found here.)
1978
Instead, we’ll fast-forward another 10 years. The year is now 1978, and the field of galaxy evolution is still—as future youth might say—a hot mess.
To be fair, we’ve made a few vast leaps in understanding since 1968. The Hubble sequence of spiral and elliptical galaxy morphologies has been fleshed out pretty well, and we’re starting to wonder how other kinds of galaxies fit in. Toomre & Toomre have made lovely simulations of interacting galaxies that reproduce a lot of the weirdly-shaped galaxies we see.
But there are still lots of open questions—in particular, no one really understands what sets the star formation rate of galaxies. We’re pretty sure that dense gas collapses to form stars (in 20 years, another seminal paper will convincingly demonstrate a relationship between gas density and star formation rate), but it’s not clear how this process varies in different kinds of galaxies.
Today’s paper
Beatrice Tinsley decides to tackle the problem of star formation rates using updated versions of her 1968 models. She and collaborator Richard Larson (of “Larson’s Laws” fame) study the colors of galaxies from two different catalogs: 1) the Hubble Atlas of Galaxies (PDF here), which has photographs of fairly “normal” spiral and elliptical galaxies; and 2) the Arp Atlas of Peculiar Galaxies, which contains galaxies that don’t fit in the typical Hubble sequence.
Larson and Tinsley compare the observed colors of galaxies in these two catalogs (Figure 1). They find that the Hubble galaxies follow a fairly tight relation between (U-B) and (B-V) colors (these are just the differences between the magnitude of a galaxy as measured in U, B and V filters). Arp galaxies have a much larger scatter, and they extend to bluer colors than the Hubble galaxies.
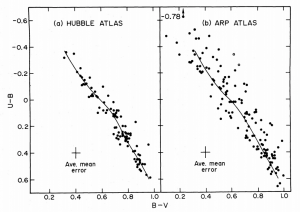
Figure 1. (U-B) vs (B-V) color for “normal morphology” galaxies from the Hubble Atlas (left) and for “peculiar” galaxies from the Arp Atlas (right). Note that more negative color indices (i.e., upper left of diagram) correspond to bluer colors. Figure 1 from paper.
Tinsley and Larson compare these observations to the theoretical predictions from the updated evolutionary synthesis models. Each model assumes that some period of vigorous star formation occurred in each galaxy, so the authors try to match the observations (Figure 2) by varying the strength of the star formation (i.e., how much of the total mass was turned into stars during this period) and the duration of the star formation period. They find that the colors of nearly all of the Hubble galaxies can be explained if the star formation rates in these galaxies didn’t vary much over time. The colors of the Arp galaxies, on the other hand, can be explained by recent intense bursts of star formation.
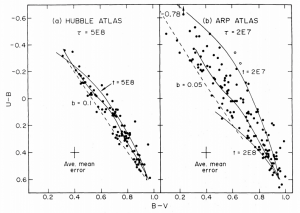
Figure 2. Same as Figure 1, but overlaid with predictions from theoretical models of galaxies with bursts of star formation. Parameters: [latex]b[/latex] is the strength of the burst, [latex]t[/latex] is the age of the burst, and [latex]\tau[/latex] is the duration of the burst.
Larson and Tinsley further investigate the Arp galaxies, and they realize that most of the scatter in the (U-B) vs. (B-V) relation comes from galaxies that show signs of tidal interactions (Figure 3). They conclude that the “burst” mode of star formation is often driven by galaxy interactions, likely because galaxy interactions help compress gas and trigger star formation.
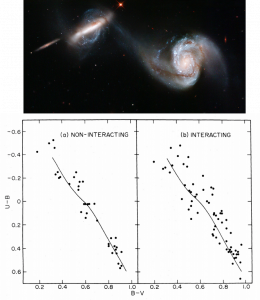
Figure 3. (Top) Arp 87, a pair of interacting galaxies from the Arp catalog. Credit: NASA/HST. (Bottom) (U-B) vs (B-V) for galaxies from the Arp catalog, separated into non-interacting (left) and interacting (right).
2018
The year is now 2018, and the exact nature of star formation in starburst and merger galaxies is still an open question. However, the link between galaxy interactions and star formation rate is clear—which is especially important in the early universe, when galaxies were forming and interacting in more dense environments—and we owe our current understanding to Larson and Tinsley’s seminal work forty years ago.
Disclaimer: my collaborator and former advisor R. Kennicutt authored the review of Tinsley’s 1968 paper linked above, and some of his comments have been paraphrased in this post.
Author