Title: XZ: Deriving redshifts from X-ray spectra of obscured AGN
Authors: Charlotte Simmonds, Johannes Buchner, Mara Salvato, Li-Ting Hsu, Franz Erik Bauer
First Author’s Institution: Pontificia Universidad Católica de Chile, Instituto de Astrofísica, Casilla 306, Santiago 22, Chile
Status: Submitted to arXiv [open access]
Looking way back by looking far away
One of the biggest mysteries of astronomy focuses on, quite fittingly, the absolute biggest astronomical phenomenon we know of: the universe, how it came to be, and where it could possibly be going. To learn more about the evolutionary timeline of the universe, scientists measure the redshifts of far-away objects like black holes and galaxies. In a surreal (and really cool) way, these far-away objects and their redshifts give us snapshots in time of how the universe looked long, long, long ago.
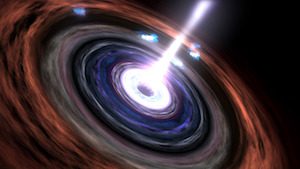
Figure 1: An artist’s impression of an active galaxy, zoomed in on its bright, brilliant nucleus. Image credit: NASA/Goddard Space Flight Center Conceptual Image Lab.
In today’s astrobite, we focus on one particular group of these far-away objects: active galactic nuclei. An active galaxy is a galaxy that has a central core giving off substantial amounts of energy. This core is what’s known as an active galactic nucleus – or AGN for short.
The authors of today’s paper highlighted two ways that scientists measure the redshifts of typical, not-active galaxies. One way is through spectroscopy, which uses the observed spectrum of a galaxy to measure the redshift. Unfortunately this way is pretty costly, and doesn’t work well on a galactic spectrum that is faint at near-infrared and optical wavelengths. The more common way is through photometry, which counts the number of photons, within a given energy band or range, that emit from the galaxy and are collected by a telescope. Given enough different energy bands, scientists can use photometry to construct a low-resolution spectrum of a galaxy and measure the redshift.
The task of teasing a redshift measurement out of a spectrum is much easier and more certain when that spectrum has strong and distinct features, like absorption and emission lines. Unfortunately, these features are difficult to distinguish when a galaxy has an AGN: the bright emission of the AGN within the galaxy tends to muddle, dilute, and/or hide the features we’d hope to observe from the surrounding galaxy’s spectrum. This makes it hard to ‘see’ the features of the galaxy in the spectrum beneath the AGN, and therefore makes it hard to measure the redshift.
But today’s authors propose a technique that can actually estimate redshifts for ‘obscured’ AGNs, using their X-ray spectra. Obscured AGNs are AGNs partially blocked by absorbing material, like clouds and dust. Strangely enough, the obscuring material partially blocking these AGNs produces new features in the spectra, which is exactly what makes the spectra, and their redshifts, easier to distinguish.
Searching for the silver linings
So how can it be that the redshift of an obscured AGN X-ray spectrum is easier to figure out than the redshift of one that’s unobscured?
The authors point out that the X-ray spectrum of an unobscured AGN, when observed at low resolution, looks like a power law – something that’s largely smooth. In this case, there are no strong features in the spectrum, which means we can’t really tell what the spectrum’s redshift is. But an obscured AGN has an X-ray spectrum for which much – but not all! – of the light is blocked and doesn’t reach the telescope. In this case, there are certain energies where less light is blocked than at other energies. These differences produce what looks like ‘edges’, which line the blocked portions of the spectrum.
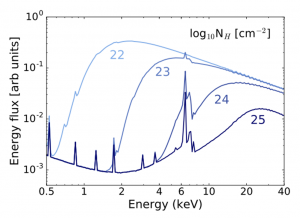
Figure 2: A normalized X-ray spectrum of a modeled AGN, plotted as a function of energy and obscurity. The number labels and colors increase with obscurity: the pale blue line labeled “22” is the least obscured, while the dark blue line labeled “25” is the most obscured. In the most obscured spectrum, we can see clear ‘edges’ of the absorbed regions of the spectrum, along with the strong Fe Kα line at around 6.4 keV. Figure 1 in the paper.
Figure 2 shows a modeled X-ray spectrum of an AGN, plotted with increasing obscurity. As the spectrum grows more and more obscured, we can see how the ‘edges’ lining the absorbed regions grow more and more pronounced. For their technique, the authors proposed using the depths and locations of these edges to model and estimate the redshifts, among other quantities, of obscured AGNs. They also proposed using a feature known as the Fe Kα line (see Figure 2) whenever possible; this feature can appear strongly for heavily obscured AGNs and improve the uncertainty of the redshift estimates.
To test their technique, the authors assembled a sample of AGN X-ray spectra previously observed towards obscured AGNs, along with photometric and (when available) spectroscopic measurements of their redshifts from previous studies. The authors gathered this data from three surveys, with a focus on the Chandra Deep Field-South (CDF-S) 4Ms deep survey data. They then used their technique to (1) estimate the redshifts of the sample and (2) compare their estimates and uncertainties to the redshifts previously measured using photometry and/or spectroscopy.
The authors found that, in general, their technique worked!
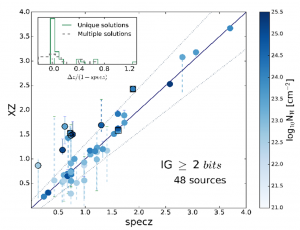
Figure 3: A plot of previous spectroscopic redshift measurements along the x-axis (labeled “specz”) against the authors’ redshift estimates along the y-axis (labeled “XZ”). The points plotted here are for obscured AGN X-ray spectra where the redshifts were fully constrained in the paper. The colors of the points indicate the obscurity of the AGN, with darker colors meaning more obscurity. The error bars of the points can be read as uncertainties in the estimates; dashed error bars indicate that the authors’ technique found other, less likely redshift solution(s). Points shaped like squares have insecure spectroscopic measurements. The solid black line draws where spectroscopic measurements would exactly equal the authors’ estimates, while the dotted black lines draw a 15% interval (shifted into redshift space) around the solid black line. Any points with error bars that don’t intersect with the solid black line are outlined in black. Finally, the histograms in the top left corner show the relative differences between the authors’ estimates and the spectroscopic measurements when either unique (the solid green histogram) or multiple (the dashed gray histogram) redshift solutions were found. Figure 5 in the paper.
Their estimated redshifts were usually consistent with spectroscopic redshift measurements when available, even when there wasn’t much X-ray data to work with. They were able to not only validate their technique against those spectroscopic measurements, but also verify the spectroscopic measurements themselves. The authors also usually found consistency between their estimates and photometric redshift measurements, independently of spectroscopic measurements. By combining their estimates with the photometric measurements, they produced much more certain and uniquely constrained redshift measurements for the AGN X-ray spectra within their sample. To be sure – there were times when their technique produced outliers and possibly problematic estimates relative to the photometric/spectroscopic measurements (as seen, for example, with the outlying points in Figure 3), and there were times when their estimates were accompanied with significant uncertainties. But overall, their technique proved to be a useful way to verify and constrain AGN redshifts with low-resolution X-ray spectra.
But their technique wasn’t just pretty effective; it was also pretty cheap! They didn’t need any data other than low-resolution X-ray spectra, and their modeling process was not complicated to apply. Looking ahead, the authors are sure that their technique will prove to be even more powerful for future deep surveys like the Athena mission, which will have even better X-ray spectral resolution than the survey data they used to check their work.
Author
Trackbacks/Pingbacks