Title: Finding mountains with molehills: the detectability of exotopography
Authors: Moiya A.S. McTier and David M. Kipping
First Author’s Institution: Department of Astronomy, Columbia University, New York
Status: Published in MNRAS [open access on arXiv]
What’s the first question that comes to mind when someone tells you they have discovered an exoplanet? Very likely, you want to know if it looks anything like the Earth. To actually answer that question, we need to not only find exoplanets but also characterize them, figuring out properties like the size of the planet, whether it has liquid water, and its atmospheric composition.
Yet another aspect one might consider is the surface topography of the planet. The Earth and other rocky bodies in the Solar System have mountains, valleys, craters, and volcanoes. Is it at all possible to detect the presence of such features on exoplanets? Apart from how mind-bogglingly amazing it would be to detect mountains on another world (think about that for a second), it would also tell us something about the planet’s internal processes, such as volcanism and tectonic plate movement. Today’s paper proposes a novel method for detecting and quantifying topographical features on the surfaces of exoplanets by using transit light curves.
The transit method and transit depth
In the transit method of detecting exoplanets, the presence of a planet is indicated by a drop in the brightness of the parent star as the planet passes in front of it. The method directly measures the sky projected area of a planet’s silhouette relative to that of a star, assuming that the planet is not luminous. The transit depth is then given by: δ = A/πR², where A is the sky projected area of the planet (basically its cross-section as viewed by us) and R is the radius of the host star.
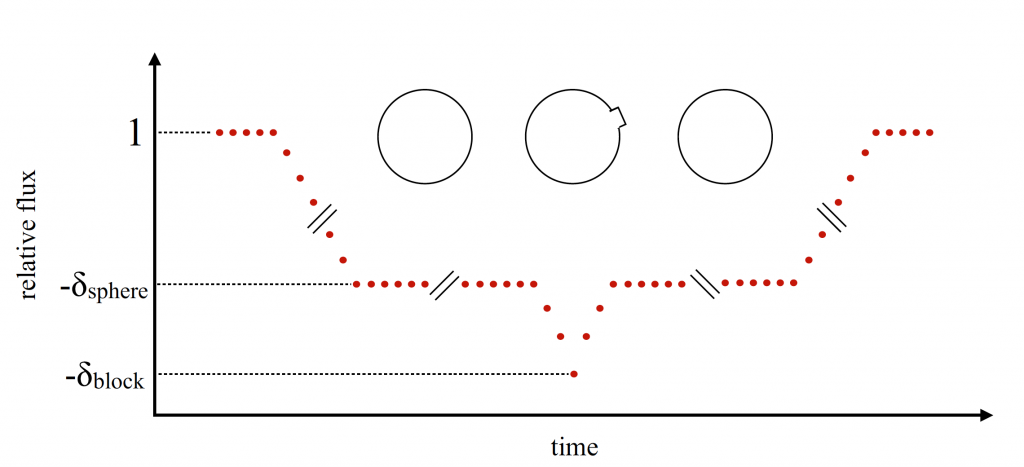
Figure 1. This plot shows how the presence of a temporarily visible feature impacts the bottom of the transit light curve as a planet rotates during its transit. Figure 1 in the paper.
The idea proposed in today’s paper is this: as an exoplanet rotates during its transit, its sky projected area will change as various features on its surface appear and disappear from the silhouette. As shown in Figure 1, this would produce a scatter in the transit depth – something we can actually measure!
The goal of this paper is to establish a relationship between the ‘bumpiness’ of a planet and the transit depth scatter we would see. To this end, the authors start out by defining a measure for bumpiness. They then gather elevation data for rocky bodies in the solar system – Mercury, Venus, Earth, Mars and the Moon – calculate the bumpiness of each, and model their transit light curves.
Bumpiness
First, we need to find a way to specify how bumpy a planet is in a quantitative sense. The authors consider three requirements:
- Bumpiness should be an inherent characteristic of the planet, independent of observations. Whether we happen to view Mt. Everest top down or sideways, it adds the same amount of bumpiness to planet Earth.
- The definition should encode the planet’s radius. This essentially means that Mt. Everest on Mercury should count as being more bumpy than Mt. Everest on Earth.
- It should account for global average features, adding up all individual contributions.
These criteria are fulfilled by the following definition of bumpiness: it’s the standard deviation of the radial distances from the centre of a planet to every point on the planet’s surface.
Transit depth scatter
Next, the authors simulate the transit light curve of the rocky bodies mentioned above. To do this, they calculate the cross-sectional area of the planet at every rotational phase, along with the corresponding transit depths. The scatter is given by the standard deviation of the transit depths.
Plotting the bumpiness against the scatter yields a relationship between the two, as is shown in Figure 2. This means that if we know the radius of the parent star and can measure the scatter in the transit depth, we can calculate the bumpiness of an exoplanet!
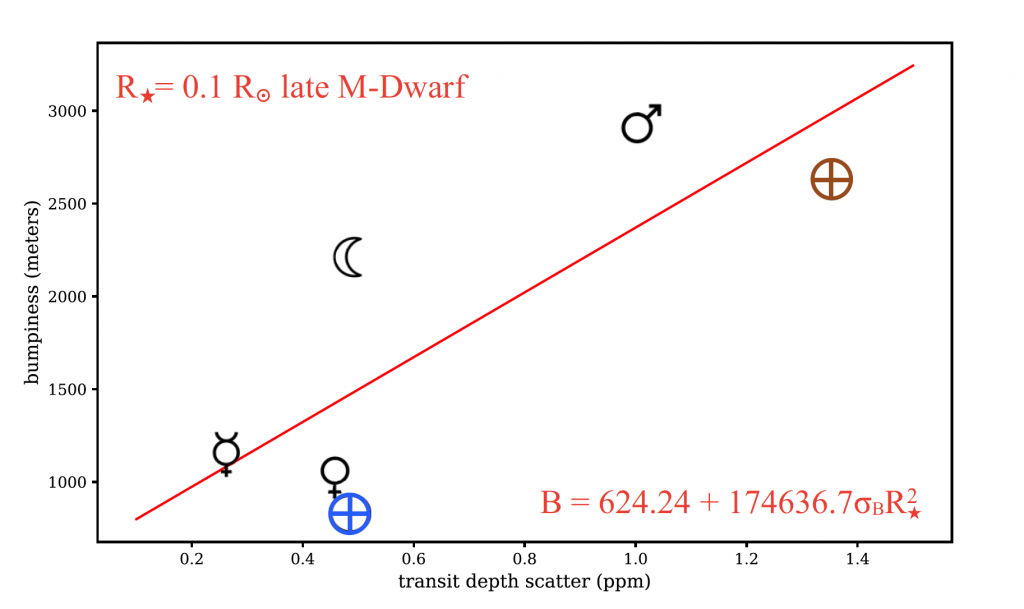
Figure 2. The relationship between bumpiness (B) and scatter () in the case of a late M-dwarf parent star with radius equal to 10% that of the Sun. The different symbols show Mercury, Venus, Earth (wet in blue, dry in brown), Mars and the Moon. Figure 6 in the paper.
Other considerations
Of course, while the idea is simple in principle, there are various complications that could arise when trying to implement this method. Sources of extra scatter, such as stellar pulsations and flares, as well as transit of exomoons, can produce false positives. Anything that decreases or eliminates scatter, such as dense clouds, oceans, obliquity (how the planet’s axis of rotation is oriented) and depressions, can produce false negatives. However, there are existing ways to deal with most of these concerns and yet others could be devised in the future.
Additionally, for the method to work, we need to either observe a planet rotating as it transits its host star or observe a planet at different rotational phases in individual transits. While the first case is ideal, the transit depth scatter can still be calculated in the second case, either by taking the standard deviation of the average transit depths, or taking the standard deviation of the folded light curve.
Unfortunately, in the cases where the planet is tidally locked (like our moon) and only a limited number of phases can be observed, this method will not be effective.
Looking ahead
With the large telescopes that are expected to come online in the next few decades, we are already set to achieve the precision necessary to observe the transit depth scatter for rocky planets orbiting white dwarfs. All signs point towards an exciting future for this brand new field!

Trackbacks/Pingbacks