Title: Walking Through an Exploded Star: Rendering Supernova Remnant Cassiopeia A into Virtual Reality
Authors: K.K. Arcand, E. Jiang, S. Price, M. Watzke, T. Sgouros, P. Edmonds
First Author’s Institution: Smithsonian Astrophysical Observatory, USA
Status: Published in Communicating Astronomy with the Public Journal, open access
How many of us have dreamed of flying among the stars? While interstellar travel is still a long way off, virtual reality can allow us to immerse ourselves in space and get up close to the astrophysical phenomena we point our telescopes at. The authors of today’s paper adapted a 3D model of a supernova remnant from Delaney and team into virtual reality.
How to make a supernova remnant
Supernovae are violent explosions which occur when the cores of massive stars run out of fuel for nuclear fusion. The core is no longer supported, so it collapses into a neutron star or black hole. This releases an enormous amount of energy, propelling the outer layers of the star outwards and producing the brilliant brightening we know as a supernova. Over time, the layers of the star slow down and interact with the interstellar medium, producing the beautiful supernova remnants we can still see today.
Cassiopeia A (Cas A) is a famous supernova remnant which resulted from an explosion potentially observable from Earth approximately 340 years ago. It has been observed extensively across multiple wavelengths, including in X-rays by Chandra, in infrared from Spitzer and optical data from ground-based telescopes. Figure 1 shows Cas A where the different colours represent different X-ray energy bands which trace different chemicals.
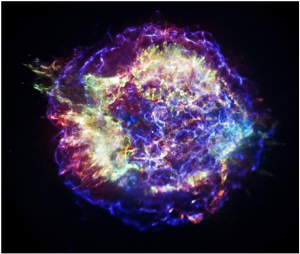
Figure 1: 2D representation of the supernova remnant Cas A. Low energy x-rays are red showing the cooler explosion debris. Medium energy are green and mostly show iron. The highest energy X-rays detected by Chandra are blue and show the outer blast wave. Yellow regions include argon and silicon. The image is about 29 light years across. Figure 1 from today’s paper, credit: NASA/CXC/SAO.
Building in 3D
Look up at the stars and the night sky appears flat: you cannot by eye tell which stars are closest to us. So how do astronomers convert the 2D data of Cas A into a 3D model? The observed spectra are shifted in wavelength compared to normal so astronomers use the Doppler effect to convert this to the velocity of the debris. As they expect the debris to be expanding radially outwards from the explosion centre, they use geometry to construct a 3D model of Cas A. The model was displayed using a medical imaging program called 3D Slicer, modified for astronomical use.
The 3D model, see Figure 2, contains two main components. This visualisation showed that the outer layers of the exploded star, composed of light elements like helium and carbon, come off the star spherically. The flattened disk-like part contains heavier elements like argon (yellow) and iron (green) from the inner layers of the star. High velocity jets of argon and iron are shooting out from the explosion in the same plane as the disk. This was the first time that the orientation and positions of the flattened disk and jets had been mapped in 3D. The blue filaments defining the outer blast wave are not mapped using the Doppler effect as they emit synchrotron radiation, meaning light is emitted as a broad continuum rather than discrete wavelengths, so this is not in the animation.
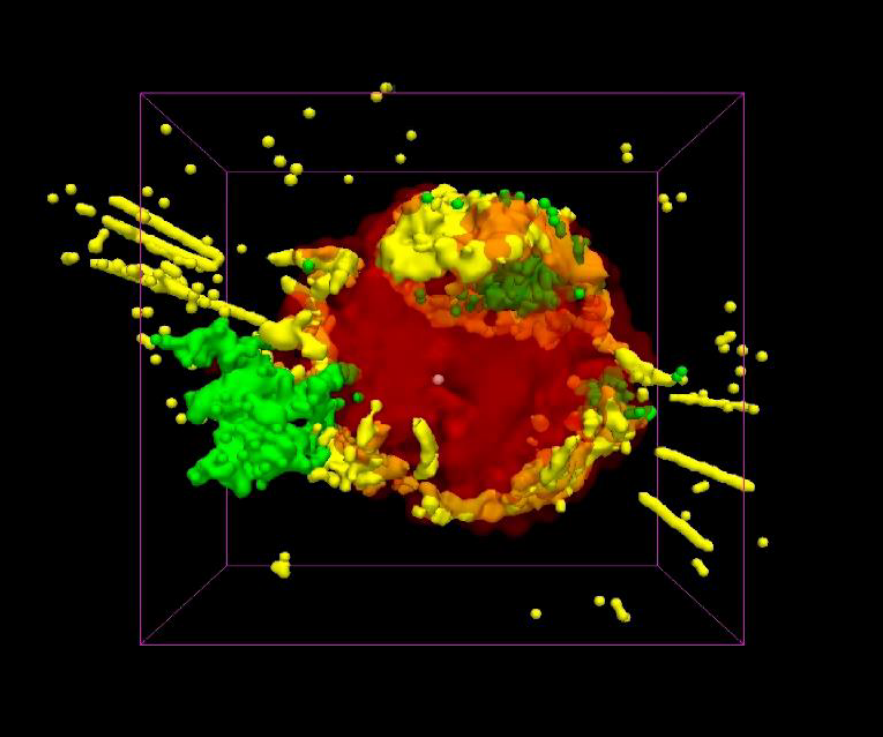
Figure 2: 3D model of Cas A. The green is mostly iron seen in X-rays and yellow mostly argon and silicon seen in x-rays, optical and infrared. The spherical red region shows the cooler debris not yet heated by the inward shock wave, seen in the infrared. Both the yellow and green are within the same plane as can be seen in the 3D representation by clicking on the image. Figure 2 from today’s paper, credit: NASA/CXC/MIT/T.Delaney et al.
Converting to Virtual Reality
We are not yet at the point where raw astronomy data can be plugged into virtual reality (VR) software, so the authors had to bridge the gap between them to make the visualisation. There are two types of data used in VR: i) volumetric data, where the data inside an object is rendered – like a CT scan allows doctors to look inside our bodies – and ii) surface data, where only the outside is rendered – like taking a photo of someone with a normal camera. The authors used the Visualisation Toolkit software to read in the supernova data collected from the different instruments and used the software’s inbuilt filters and mappers to render the remnant’s volume and surface. The authors then had to integrate the Visualisation Toolkit program with MinVR, their toolkit to display the VR.
Seeing in VR
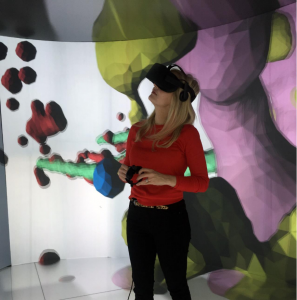
Figure 3: Cas A in virtual reality inside the Brown University VR cave. Click on the image to explore for yourself. Figure 3 from today’s paper.
So what are the advantages of VR? VR allows the user to explore the inside of the supernova remnant themselves in 3D (Figure 3). Users can select parts to interact with which brings up captions explaining what they are (Figure 4).
While the VR was designed for 3D immersive environments like Oculus Rift (such as that in Figure 3), it has also been adapted for use online with Google Cardboard optional for a more immersive experience, allowing more users to access this experience.
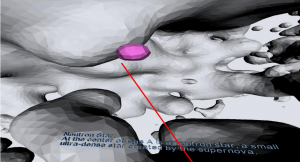
Figure 4: Virtual reality view within Cas A, showing the neutron star with captions. Figure 6a from today’s paper.
Is the Future in VR?
VR is gaining in popularity for video games as the technology becomes less expensive, but are the public actually interested in engaging with astronomy through VR? Another team, led by Ferrand, suggest this is the case, finding their VR booth was very popular with visitors of all ages, with many queueing for over an hour at the Astrophysical Big Bang Laboratory at Riken in Japan. Visitors were very impressed by being able to step inside the supernova and found it remarkable that they were looking at a scientific simulation of a supernova.
VR has the potential to engage non-experts with visualisations of astrophysical phenomena and models from real scientific data and simulations. The authors plan to build more visualisations including the life-cycle of stars and other supernova. They hope their generic program could act as a skeleton to make other VR models much more easily for astronomy and biomedical fields. Perhaps, if these advancements occur, astronomers of the future will simply upload their observations or simulations into VR and physically immerse themselves to analyse their data.
Author
Rhys Taylor and I are big fans of 3D visualizations, too. Here are some of his:
http://www.rhysy.net/mapping-the-universe-1.html
http://www.rhysy.net/visualising-virgo.html
http://www.rhysy.net/virgo-explorer.html
I’ve “recently” switched to three.js/WebGL for browser-interactive 3D models. This one is older, larger, and more colorful but also less accurate (redshifts are directly converted to distance, which smears clustered galaxies into radial streaks):
http://gregroelofs.com/3D/43487-galaxies/
This is a newer, more local version with only 1179 galaxies, though all of them are labeled, and the positions are more accurate (though there are still some visible artifacts):
http://gregroelofs.com/3D/43487-galaxies/local-galaxies.html
I also made a 3D model of the stars orbiting the Milky Way’s central black hole long ago, but it’s still available only in VRML format, which isn’t very useful to most folks:
http://gregroelofs.com/3D/galactic-center-orbits.wrl
One of these days I’ll get around to sampling the Gaia stellar data, too, but that’s a bit overwhelming at the moment. I’d also like to make the models more VR-friendly, but I have no way to test that at the moment.
Thanks for sharing, very interesting to see what visualisation work is being done for astronomy!
Thanks for covering our paper! There are a couple sessions at the AAS next week on 3D astroviz if folks are interested. Eg, one on M51.
That sounds really cool, thanks for letting us know.