Title: Morpheus: A Deep Learning Framework For Pixel-Level Analysis of Astronomical Image Data
Authors: Ryan Hausen & Brant Robertson
First Author’s Institution: UC Santa Cruz
Status: Submitted to AAS Journals, open access on arXiv
Dreaming of a better way to classify galaxies
In Greek mythology, Morpheus is the God of Dreams, who shaped and formed the dreams of mortals. It is fitting, then, that Morpheus is now dabbling in classifying galaxies based on their shape, to help us mortals with our astronomy. Born of Tensorflow and Python 3, the 21st-century Morpheus is a new neural network dreamed up by the authors of today’s paper to perform galaxy classification.
The shape, or morphology, of galaxies is critical to understanding their formation and evolution. As it is such an important characteristic, astronomers must have found a robust algorithm or quantitative model that determines morphology, right? Not quite—it turns out that the most accurate way to classify galaxies morphologically is to round up a pack of trained astronomers and have them look through pictures of galaxies by eye.
Unfortunately, galaxies far outnumber astronomers. The most well-known method that overcomes this is Galaxy Zoo, which enlists interested internet users to classify galaxies. While very successful, this is still limited by accuracy and scalability. To address these issues, researchers have begun to use machine learning techniques to push morphological classification forward.
Today’s paper introduces Morpheus, a new deep learning network to classify astronomical images. The network determines the morphological type of each pixel in an astronomical image, increasing its capabilities beyond existing methods.
How to Train Your Neural Net
Neural networks like Morpheus work by learning how inputs, often images, are associated with their desired outputs, often called labels. For example, you could train a network by feeding it images of cats and dogs, labeled with the appropriate word “cat” or “dog.” Then, when you input new images of furry friends it hasn’t seen before, it should be able to assign each the appropriate label. Check out this astrobite for a great explanation.
In the case of Morpheus, the inputs are images of galaxies through multiple color filters. (This is already an improvement over previous methods, which use composite images.) The labels are the morphologies of the galaxies: disk, spheroid, and irregular, as well as point source/compact to account for unresolved sources.
The authors trained Morpheus on images of 7,629 galaxies in the CANDELS survey, in the GOODS South region. To label these training images, we still need that pack of trained astronomers: multiple experts voted on the classification of each galaxy. Morpheus goes beyond previous works by using not just the winning classification, but all of the expert votes as labels. This allows the network to learn the uncertainties in morphology, for example knowing when a certain source looks similar to both disks and spheroids. Further, it learns which pixels in the images are most relevant to the experts’ votes.
Morpheus then outputs a “classification image,” which labels each pixel with the probability that it corresponds to each classification. This allows for not only the classification of objects, but also spatially resolved morphological information and source detection.
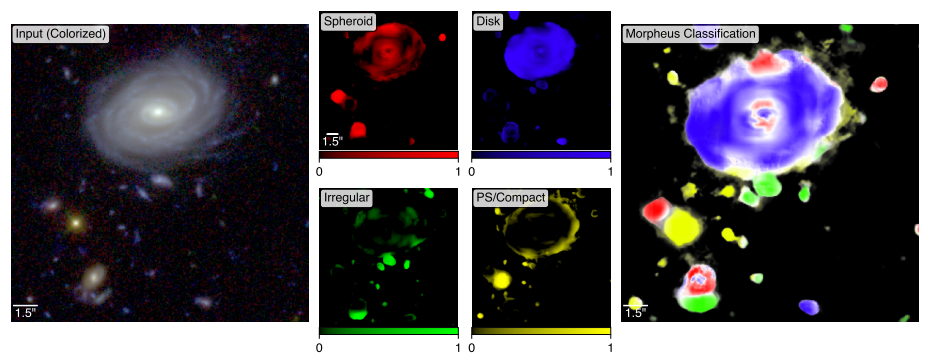
Figure 1: An example field classified by Morpheus. Left panel: A composite image of the input data. Middle panels: The dominant classification of each pixel. Right panel: The output Morpheus “classification image” color-coded by dominant morphology. The brightness of the color indicates the dominance of the most dominant morphology of each pixel, with white meaning indeterminate classification. (Modified from Figure 5 in the paper)
Figure 1 shows a field region classified by Morpheus. The left panel shows a composite image of the input data, with many galaxies and other objects visible. The 4 panels to the right show the dominant label of each pixel for the types spheroid (red), disk (blue), irregular (green), and point source/compact (yellow). The Morpheus classification image on the right again shows the dominant morphology of each pixel, now with the brightness corresponding to the difference between the dominant class and the second-most dominant class, so that white pixels mean similar results for multiple classes. The brightest objects in the image are well-classified into their visually apparent galaxy morphologies, while the fainter objects are mostly classified as point sources.
Morpheus classifies the entire GOODS South field in this way. Figure 2 shows the result, with the colors again corresponding to the dominant type, with more certain classifications in brighter colors. To see Morpheus at work, check out this mesmerizing video.
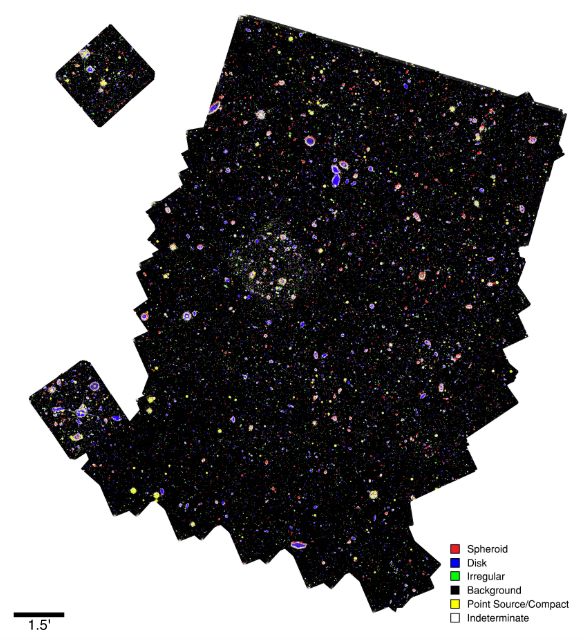
Figure 2: Morpheus’s pixel-level classification of the GOODS South region. The colors correspond to the dominant classification of each pixel, with white meaning comparable classifications for the pixel. (Figure 11 in the paper)
Evaluating galaxy classification: Morpheus vs. astronomers
If Morpheus is classifying pixels and the astronomers classified objects, how can we compare the two to measure Morpheus’s performance? The authors do this by computing the brightness-weighted average of the pixels in the object and selecting the dominant classification. But we still expect some uncertainty in the classification, because for many sources even the “truth” (astronomer-determined labels) was unclear. As Morpheus was trained not just on the majority-voted classification but on all of the votes, Morpheus’s assignments should match the distribution of astronomer votes. This can be evaluated by looking at the confusion matrix, shown in Figure 3.
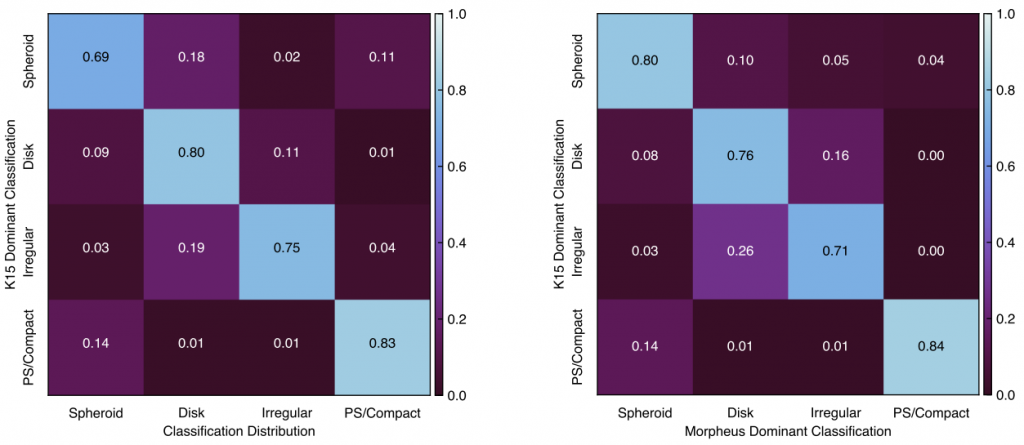
Figure 3: Confusion matrices that show the distribution of morphology classifications. The left matrix shows the degeneracies in visual assignment by astronomers, and the right matrix shows Morpheus’s replication of those degeneracies in its assignments. (Figures 14 and 15 in the paper)
The matrix on the left shows the natural degeneracies in astronomer-classified objects, meaning how often astronomers confused two types of galaxies for each other. For example, for objects that the majority (80%) of astronomers agreed were disks (the “K15 Dominant Classification” axis), the remaining astronomers classified as spheroids 9% of the time and irregulars 11% of the time (the “Classification Distribution” axis). The matrix on the right shows the Morpheus vs. astronomer degeneracies. Continuing the above example, for objects that the majority of astronomers labeled as disks, Morpheus agreed for 76% of the objects but thought that 8% were spheroids and 16% were irregulars, close to the astronomer distribution. The two matrices clearly agree quite well overall, showing that Morpheus succeeds at reproducing the intrinsic uncertainty (represented by astronomer disagreement) in the object classifications.
The authors use many other metrics to evaluate how Morpheus performs, including inserting simulated sources to test for false negatives and completeness. These couldn’t all fit in an astrobite, so check out the paper to learn more!
The authors anticipate that Morpheus will be useful for upcoming large-scale imaging surveys, and can also be expanded to learn other information like galaxy redshift. Keep an eye open for what the Morpheus team will dream up next.
Author