Title: Opening the Black Box of Deep Neural Networks via Information
Authors: Ravid Shwartz-Ziv, Naftali Tishby
First author’s institution: The Hebrew University of Jerusalem
Status: Posted to arXiv, 2017 [open access]
Until very recently, computers struggled to answer the easiest question in the world:
What is this a picture of?
Figure 1. A very good dog.
The answer, of course, is “a very good dog.” Most humans can identify this very good dog effortlessly–over the millennia, our brains have evolved to take the pattern of light striking our eyes and translate it almost instantaneously into a conceptual understanding of what we’re seeing. But computers don’t have that translating power. When a computer looks at this picture of a very good dog, it doesn’t see a very good dog: it only sees a grid of pixels, each with some attached numbers to indicate its color.
Imitating the brain
Only within the last five years have researchers been able to teach computers to recognize that pixel grid as a very good dog, and to recognize other pixel grids as very good birds, or mice, or iguanas. They’ve done it by writing programs that imitate, at a very basic level, the image recognition process that goes on in the brain, the one that takes a pattern of light-stimulated cells in the retina and feeds it forward to the part of the brain that understands “Dog.”
These programs are called neural networks. They translate some input data, like a pixel grid representing a dog, to some output data, like the word “Dog.” The process of translation is an arithmetic one, because to the computer, the dog has always been a bunch of numbers. But it can take those numbers and identify clever weighted combinations of them that point, reliably, to the answer “Dog.”
The mystery of “deep” learning
So-called “deep” neural networks break up the mapping from the input to the output into many intermediate, layered stages; the first layer takes the pixel grid and translates it to some intermediate set of numbers, the second takes the first layer’s output and translates it again, and on and on. A dozen or so layers down the line, the intermediate output is translated to “Dog” as the final step.
Like the human brain, neural networks require a period of learning and training to figure out what arithmetic mapping to do. Researchers show the neural networks many, many examples of dogs, and birds, and mice, and iguanas, and the network fiddles around with its weights and combinations till it starts getting the answers right.
The problem is, even when the answers are right, it’s not at all clear how the computer is getting them. Those arithmetic mappings rarely have obvious meanings–sometimes, we can look at a particular layer and say with reasonable confidence that it’s learned to pick out sharp edges in the image, or blocks of continuous color. But that’s a long way from understanding what makes a dog.
This is a big problem for astronomers who want to teach neural networks to solve research problems: for example, to classify stars, or identify interesting transient signals, or predict the properties of a simulated galaxy. If our goal is to understand the universe, It’s really not enough that a network be able to do these tasks–we must understand what information the network is exploiting to be able to do them. Cue today’s paper!
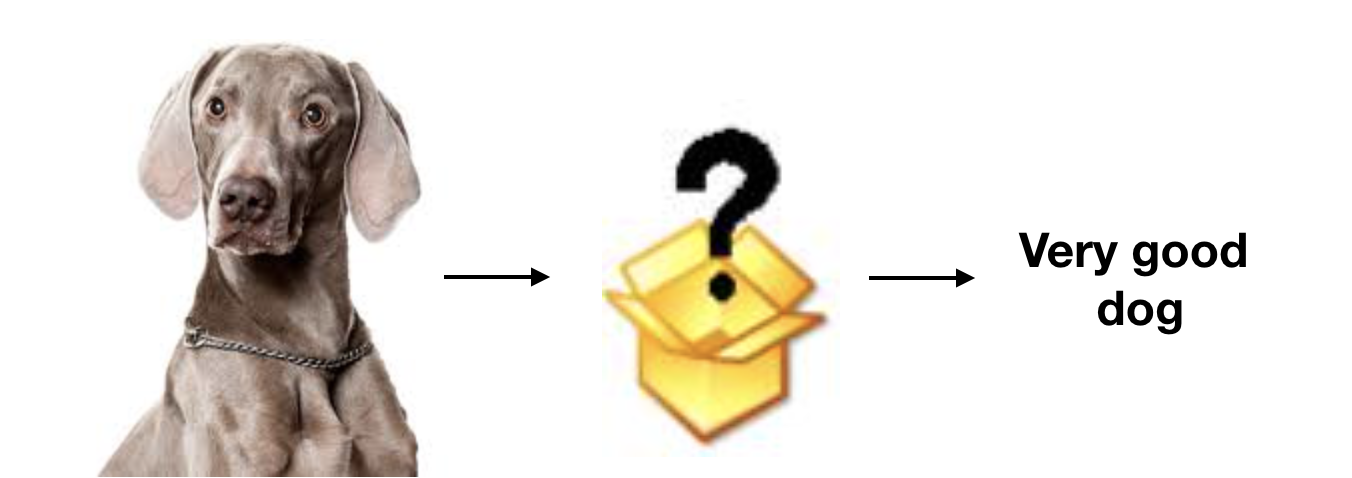
Figure 2. Great, neural networks understand how to recognize images! But we don’t understand how they do it.
Some new information
Today’s authors, who are computer scientists and neuroscientists, offer a new insight into what’s going on under the hood while a neural network trains to do a task like recognize images. This training seems to proceed in two phases: a fast first stage when the network connects every possible detail of the input data to the output, and then a slower second stage where it forgets some of those connections. Check out a picture of the training process:
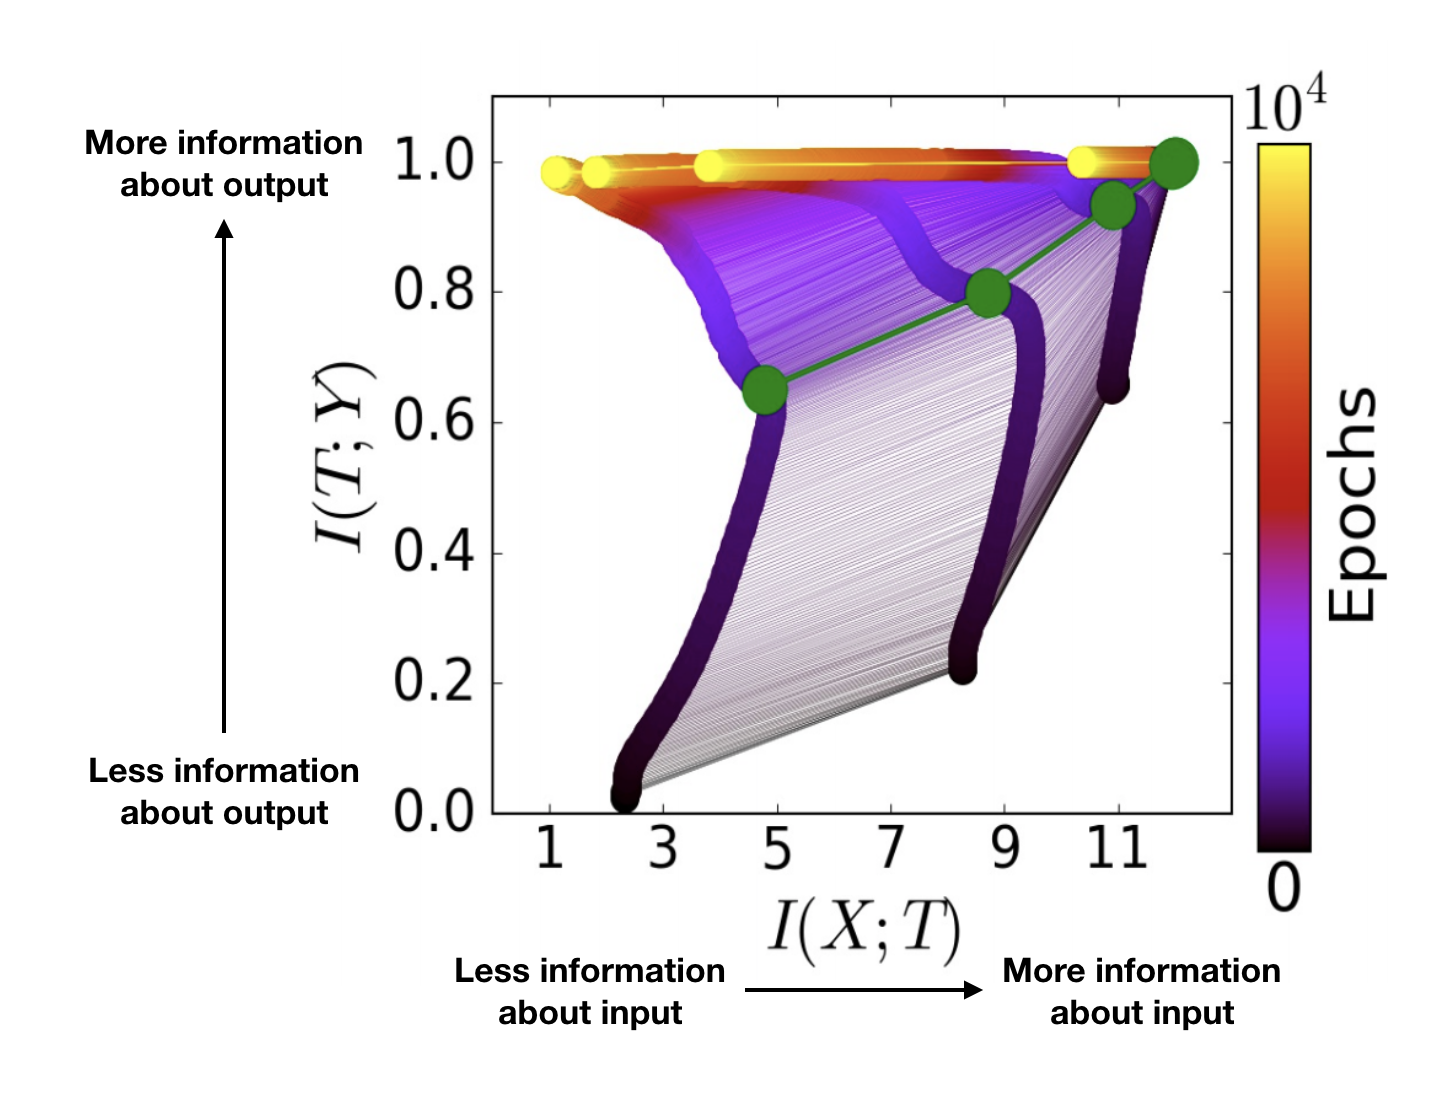
Figure 3. A deep neural network’s training process, pictured in the “information plane.” The upper right corner represents the input layer; by definition, it knows everything possible about the input, which is why it’s so far to the right on the x-axis. The whole enterprise of predicting the output from the input depends on the input layer containing information about the output, which is why it’s also so high up on the y-axis.
The x-axis represents the amount of information that each layer contains about the input data, and the y-axis represents the amount of information that each layer contains about the output data. Each sort-of-horizontal set of connected dots represents the state of the entire network (several layers connected in sequence) at a particular time during its training, with early times in black and late times in yellow. Each sort-of-vertical track represents one network layer, with the input layer rightmost and the output layer leftmost. At the beginning of its training, the network occupied the lowermost line, extending from the lower left to upper right; at the end, it occupied the topmost, stretching horizontally across the top of the figure.
Notice the dogleg bend in all the tracks, highlighted by the green dots. Below this dogleg, as the layers climb up the y-axis and get better and better at predicting the output, they’re also creeping to the right. In other words, they’re learning more and more about the input layer. After the dogleg, the layers continue to climb the y-axis–in other words, they continue to improve at predicting the answer–but, simultaneously, they slide leftward! They’re forgetting information about the input.
Forgetting to learn
The authors posit that, during this “forgetting” stage, the network is discarding information that’s irrelevant to the task at hand. For example, in image recognition, the background contains very little information about the ultimate classification of the image–a dog is a dog, regardless of what it’s standing in front of.
Mathematically, you can separate the two training stages by what’s going on with the network’s weighted connections from input to output, as shown in Figure 4.
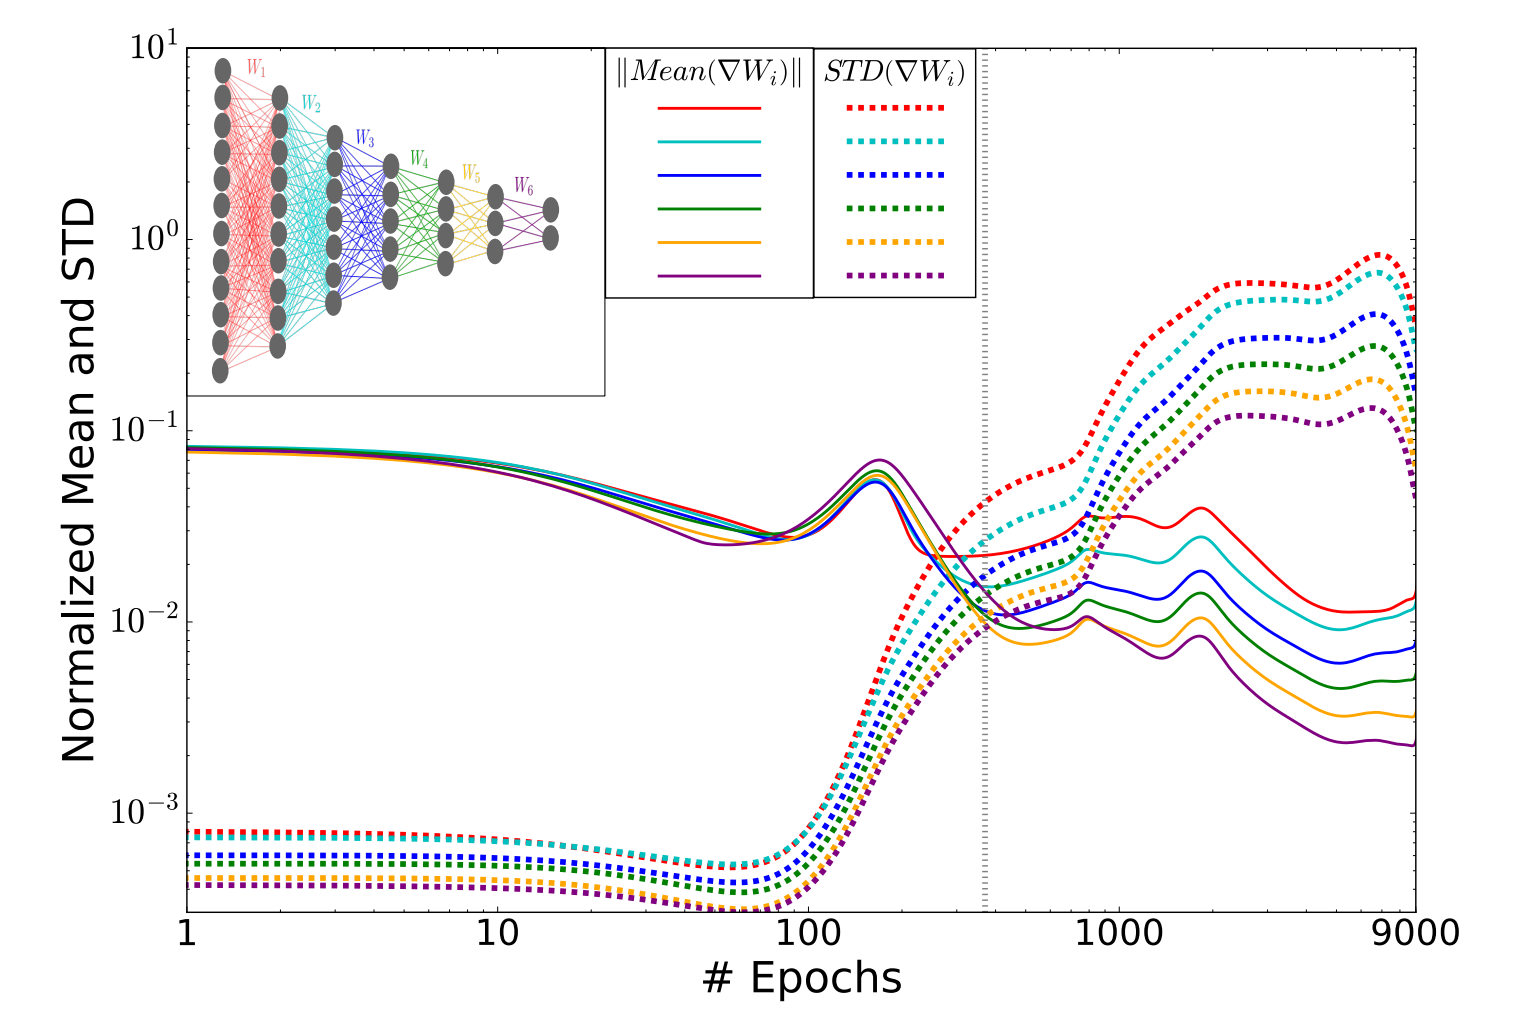
Figure 4. Solid lines: The average rates of change of the network weights. Dotted lines: The standard deviations of the changes in the network weights. The shift from the first to the second training phase is marked with a dotted vertical line. In the inset is a diagram of the whole seven-layer network.
The network trains its weights by shifting each of them up or down, a little bit at a time. It decides whether to shift a weight up or down based on which direction improves the network’s overall performance the most. In the first phase of training, when the network is learning everything it can about the problem, it changes its weights with a sense of purpose, making big shifts that result in big initial improvements. That’s why the solid lines in the above figure, which represent the average rates of change of the weights in each layer, start out so high.
When the network shifts to its forgetting phase, however, the weights start behaving differently–they lose their sense of purpose (so the solid lines fall) and begin meandering around more randomly. The dotted lines represent the standard deviation in the changes to the weights at each layer, which measures this “randomness.”
So, do we understand networks now?
Amazingly, these two training phases seem to be common to all successful deep networks tested by the authors. So we’re one step closer to understanding how networks learn to do their tasks so well.
The authors caution, however, that interpreting what any particular layer, let alone any particular weight, is contributing toward the accomplishment of that task may be a lost cause. Some of their other experiments indicate that many different final arithmetic mappings in the network can be equally successful at achieving a particular task. In other words, there is no unique “best” mapping , and as a result, individual pieces of any given successful network do not necessarily correspond to meaningful translations of the input data. Good news for astronomers–networks won’t be putting us out of business anytime soon!
For more on this paper, see this excellent writeup at Quanta magazine!
Author