Title: Star formation quenching imprinted on the internal structure of naked red nuggets
Authors: Ignacio Martín-Navarro, Glenn van de Ven & Akın Yıldırım
First Author’s Institution: University of California Santa Cruz; Max-Planck Institut fur Astronomie
Status: Accepted to MNRAS , open access
The evolution of galaxies as they age is a tricky thing to study. Even if we had observed a galaxy over the entire course of human history it would only have been a small fraction of that galaxy’s lifetime. Because of this, studying galaxies involves looking at an ensemble of galaxies from far away (where we see light emitted when the galaxy was young) to nearby (where we see galaxies roughly as they are today). The problem with this is that we can’t see how a single galaxy evolves, only snapshots of different galaxies over time. Imagine seeing a collection of photographs of different people at different ages, you could get some understanding of the general aging process but you would still be missing some key information.
Galaxy Evolution
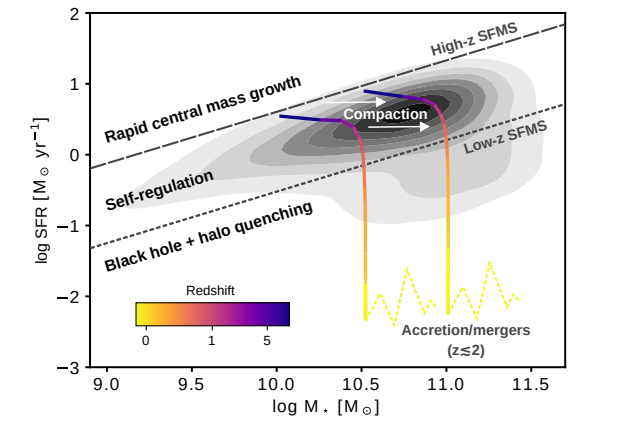
Figure 1: An illustration of star formation rate versus stellar mass of a galaxy over it’s evolution overlaid with data from the naked red nuggets. The top dashed line indicates the general relationship (“main sequence”) for younger galaxies and the bottom dotted line indicates the general relationship for older galaxies. In between these lines, galaxies undergo the compaction phase, where the central mass increases. The colored lines show how the lower mass (left) and higher mass (right) samples in this study change as they age (remember high-z means a younger galaxy). While the naked red nuggets start near the high-z main sequence, they fall off the low-z main sequence because they are not actively accreting like the other galaxies. (Source: Figure 8 in the paper)
Galaxies can be broken up into two different categories: blue and red. Bluer galaxies appear that way because they have younger stars; they have a high star formation rate where the young stars dominate. Redder galaxies have stopped forming stars at a high rate and appear red because they are dominated by the red old stars. There are very few galaxies in between these categories, so it can be assumed that there is some process that is relatively quick that quenches star formation. Figure 1 shows an illustration of the evolution process with two trends that represent pre- and post- quenching.
A big question in galaxy evolution is what, exactly, that process is. Studying red (quenched) galaxies could help uncover that process, but the information is often contaminated by material that was added to the galaxy through mergers that occurred after the quenching. However, there are a few red galaxies that have remained “naked” by not undergoing any major merging episodes. These galaxies have compact cores, hence why they are called “naked red nuggets.” Using information from these galaxies, the authors of today’s paper were able to learn more about galaxies after they undergo quenching.
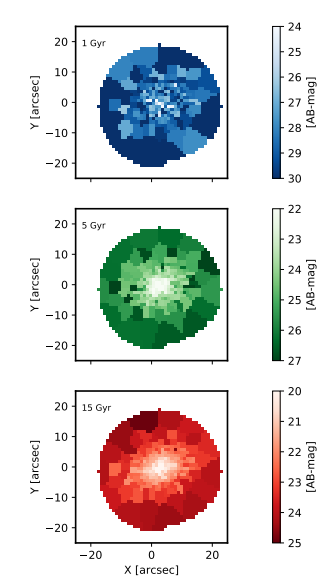
Figure 2: A map of the galaxy UGC2698’s stars that formed 1 Gyr, 5 Gyr and 15 Gyr ago. The color bars indicate the brightness of the galaxy, with whiter areas representing younger stars. This clearly shows that the internal structure of a galaxy changes over time. (Source: Figure 3 in the paper)
The Key to Quenching
The authors were able to look at the twelve naked red nuggets in their sample and sort the stars by age. Figure 2 shows one of the galaxies in the sample at three different times in its life. As the galaxy ages, there are fewer new stars and they are formed closer to the center.
Figure 3 shows how the central density (Σ1) and star formation are related to each other for each galaxy in the sample. These evolutionary tracks are remarkably similar to what has been theoretically predicted. As new stars are formed and migrate toward the center of the galaxy, the central density increases,until it reaches a point where the star formation drops off and the central density remains at its maximum.
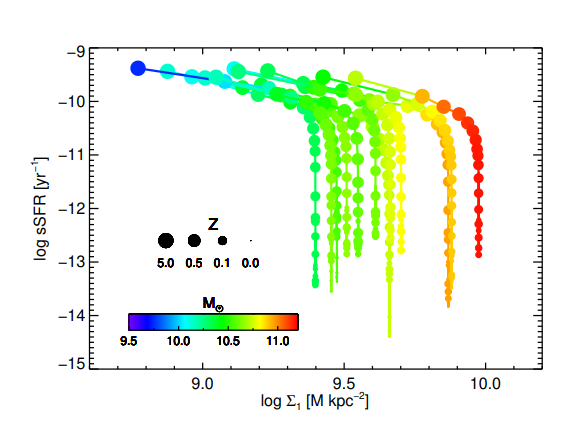
Figure 3: Each connected line of dots represents one of the naked red nuggets in the study. The larger the dot, the younger the galaxy was at that time. The colors represent the masses at that time. As the galaxy gets older, the star formation rate (SFR) slows gradually until it drops off at a certain central density. (Source: Figure 2 in the paper)
One of the possible causes of quenching may be energy released by the supermassive black hole at the center of most galaxies. As the central density increases, the black hole accretes more material and releases more energy. The maximum central density may correspond to a point where the black hole is accreting enough matter that the energy released is enough to stop star formation.
The authors conclude that of all the parameters they explored, the only predictor of quenching seemed to be the ratio of central density to total galaxy mass. Other independent observational studies support this by finding that star formation and black hole activity are connected.
Author