Authors: Ildar Khabibullin, Eugene Churazov, and Rashid Sunyaev
First Author’s Institution: MPI für Astrophysik, Germany and Space Research Institute, Russia
Status: Submitted to MNRAS
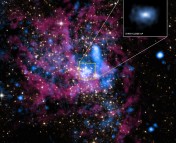
Every so often, the supermassive black hole at the center of our Galaxy, known as Sgr A*, has a flare-up. The black hole doesn’t get zits, rather, it gives off more light than usual. These flare-ups last a few hours before they die back down, to a relatively dim state. The regular light comes from the accretion of material, and if that rate of accretion increases, so will the emission. (To read more about accretion onto Sgr A*, check out this Astrobite.)
About 120 years ago, Sgr A* had a flare that was much brighter than typical flares and lasted about 1.5 years. The event was so bright that it’s echoes can still be seen now as it reflects off of clouds. Within about 500 pc of Sgr A* is a region known as the Central Molecular Zone, which contains dense molecular clouds. The light from the flare, having traveled 120 years from our perspective (but instantaneously for the light), hits the molecular clouds and bounce back toward us.
From the X-ray emission of these clouds, we can infer when the flare happened based on how far the cloud is from the source. This is from a technique called reverberation mapping, which can be used in active galaxies to learn more about their black holes. The authors of today’s paper presented a way to learn more than just the timing of Sgr A*’s flares, using a property of light known as polarization.
Polarization as a Property
Light is made up of both electric and magnetic fields, oscillating perpendicular to each other and the direction of propagation. Many of the lights we experience on a day-to-day basis are unpolarized – meaning that the direction of the electric field is random for any given photon. However, many astronomical processes produce polarized light. That is, the electric field of the light preferentially lies in one direction. The degree of polarization indicates just how much of the light behaves this way.
The light we receive from the dense molecular clouds that are reflecting the historical flare is polarized, as we might expect. If the light from the source is unpolarized, then the scattered light is polarized (see the blue lines in Fig. 1) so that the electric field is perpendicular to the scattering plane (in Fig. 1 this is the x-z plane). If the source is emitting polarized light (the red lines in Fig. 1), things get a little more complicated. Essentially, both the degree of polarization and the angle of polarization depend on the orientation of the source electric field to the scattering plane (angle Φ in Fig. 1).
Applications and Limitations
Based on the geometry of scattering and our ability to measure polarization, we can usually deduce where the original light is coming from. However, if we think we already know where the source is (in this case, the location of Sgr A*), we can use the polarization information to deduce whether or not the emission from the source is polarized, and if so, the polarization properties.
Here’s the catch: we can’t currently measure the polarization of the x-rays from these clouds. However, the Imaging X-Ray Polarimetry Explorer (IXPE) will have that very capability. Currently planned to launch in April 2021, this spacecraft will improve the sensitivity of polarization data by two orders of magnitude and will be able to probe the dense molecular clouds that are currently being lit by the historical flare.
In anticipation of this, today’s authors produced Fig. 2, a predicted polarization map overlaying a map of the x-ray emission produced by the Chandra X-ray Observatory. The white lines indicate the angle of polarization if the source of the flare was unpolarized and the black lines represent a polarized source.
With IXPE, we will be able to resolve the properties of polarization of individual clouds and compare them to the different scenarios presented in this paper and shed light on the physical origin of the flare. This could answer the important question of how the flare from 120 years ago originated, whether it is just a larger event of the types we see today, or if something else caused it. There are other historical flares that could be examined in this way as well. This could possibly lead to predicting future flares, which could present as yet unknown astronomical opportunities.


