Authors: Lizzie Elmer, O. Almaini, M. Merrifield, W. G. Hartley, D. T. Maltby, A. Lawrence, I. Botti, P. Hirst
First Author’s Institution: University of Nottingham, Nottingham, UK
Status: Accepted in MNRAS, open access on arXiv
Reciting the rhyme “Twinkle, twinkle, little star” is the first introduction most people will have to studying astronomical variability. As light from a far-off star meets the Earth’s turbulent atmosphere, it bends away from the observer causing the infamous twinkle. Observing this ‘twinkle’ is a trick that amateur astronomers can use to differentiate between stars and other objects. Similarly, observing the time-variation in light from astronomical sources is a crucial technique in research astronomy to help identify the nature of an unknown source. Today’s paper focuses on using this technique to identifying active galactic nuclei (AGN), a supermassive black hole at the centre of a galaxy that emits huge amounts of radiation.
AGN emission is heavily dependent on the rate and volume of material being accreted, so the AGN light we observe can be highly variable. As variation in the AGN light propagate through the host galaxy it interacts with surrounding material. This creates similar variations in the accretion disk at optical wavelengths, and the torus at infrared wavelengths. The largest AGN variations seen over the longest timescales are found at longer detection wavelengths as light takes significant time to travel through the host galaxy. So, today’s authors take advantage of this scaling effect and attempt to use near-Infrared (NIR) emission to identify AGN activity.
Removing Little Stars (and Bigger Ones too)
The authors search the 0.8 square degree region of the sky covered by the UKIRT’s Ultra Deep Survey (UDS). This region has been measured by the UKIRT for 8 years and has data stored in as many image files. By using UDS data, the authors aim to maximise the potential for AGN variability and minimise contamination from other variable sources such as Supernovae. Not only does supernova emission have a very characteristic decay, unlike AGN, but the full phenomenon is known to resolve itself in just under a year. This effect will be minimised by the near-yearly intervals of UDS observations.
The next biggest source of error is from differences in the point-spread function (PSF) – how the telescope responds to light – between images. This is likely due to changing atmospheric conditions across observation periods. To remove this, they recreated the worst PSF and applied it to every image. By applying these corrections and removing problematic objects such as known galactic stars and objects affected by image artefacts, the authors believe the most significant non-AGN sources of variability have been minimised.
Is an AGN, what you are?
AGN variability at longer wavelengths like NIR is aperiodic, of large magnitude and occurs over extended timescales. So, the authors attempt to isolate objects with the most continuously variable fluxes. To do this they calculate a chi-squared value for each source. Each yearly flux detection is subtracted from the source’s mean flux, squared, and divided by that measurement’s uncertainty. All these deviations are then summed, which results in the source’s chi-squared value. The authors argue that any source with a chi-squared of greater than 30 has shown sufficient variability to potentially be an AGN. Light curves that pass or miss this threshold are highlighted in figure 1. 393 objects exceeded the variability threshold. All of which had colours and morphologies that were consistent with originating from a galaxy not a star, so the authors conclude that these objects are AGN.
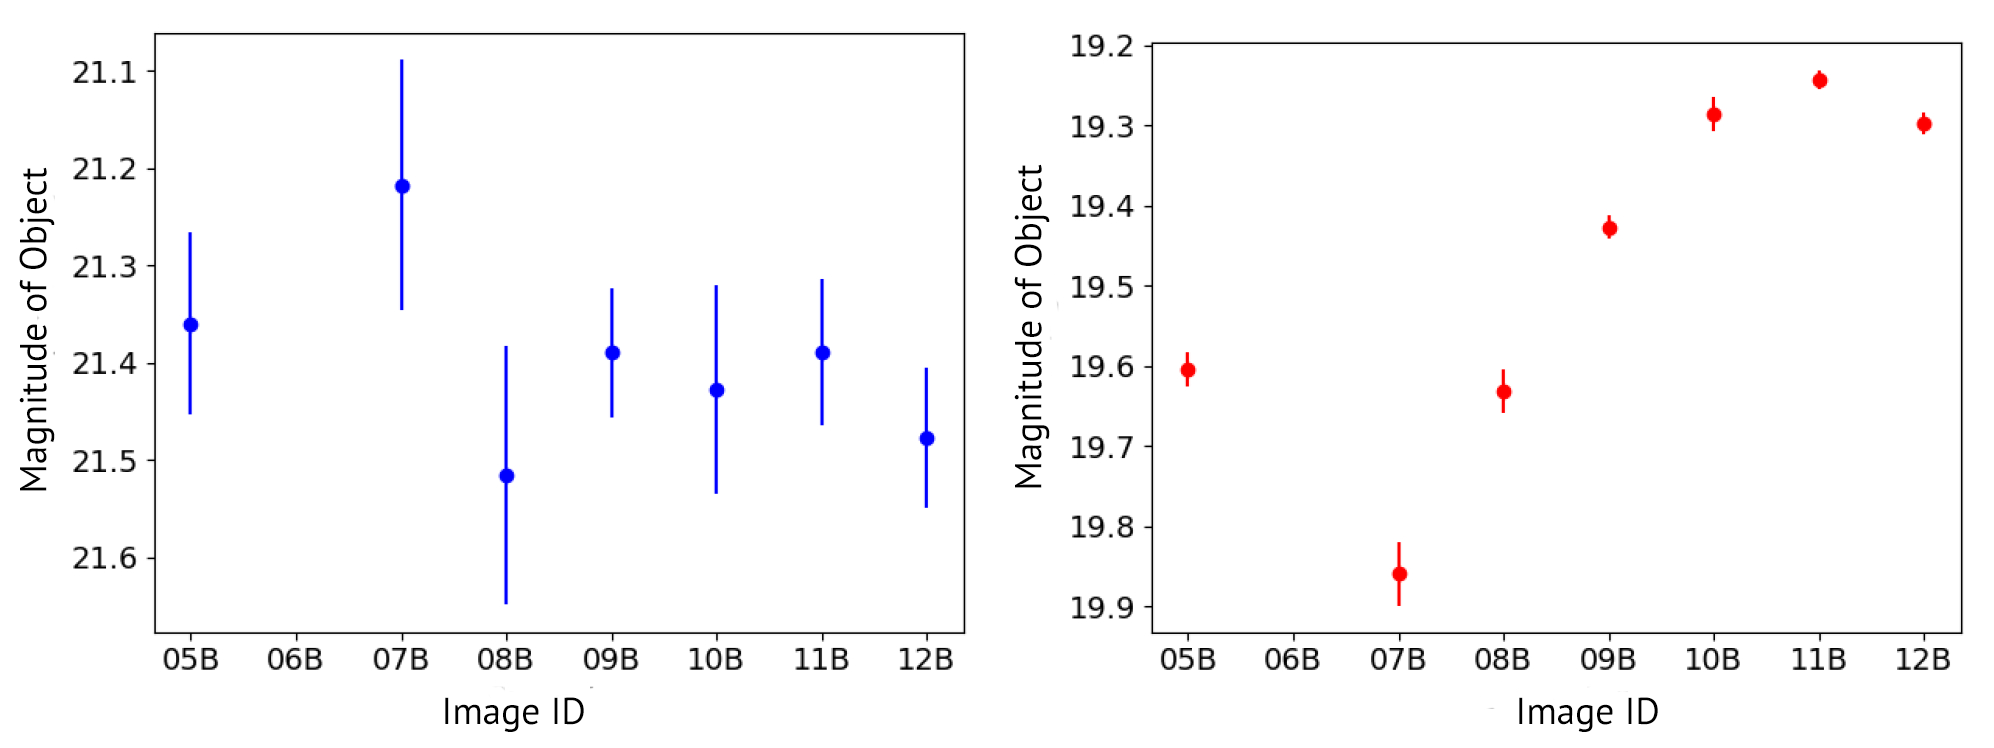
Figure 1: A comparison of two light curves across the full period of observation i.e. how bright the object is in each image (with time going from left to right). The blue light curve on the left was rejected because its chi-squared value was too low, given the large error bars and relatively small period of variability. The red light curve on the right was deemed variable enough to be considered an AGN, as the points are well-measured and trace a very variable curve. Adapted from figures 4 & 5 in today’s paper.
AGN are more commonly identified in the X-ray part of the spectrum, so the authors used a sample of 593 X-ray selected AGN found in the same sky area for comparison. By performing this comparison, they split up the sample into three categories to analyse: X-ray only selected, X-ray & variability selected and variability only selected AGN.
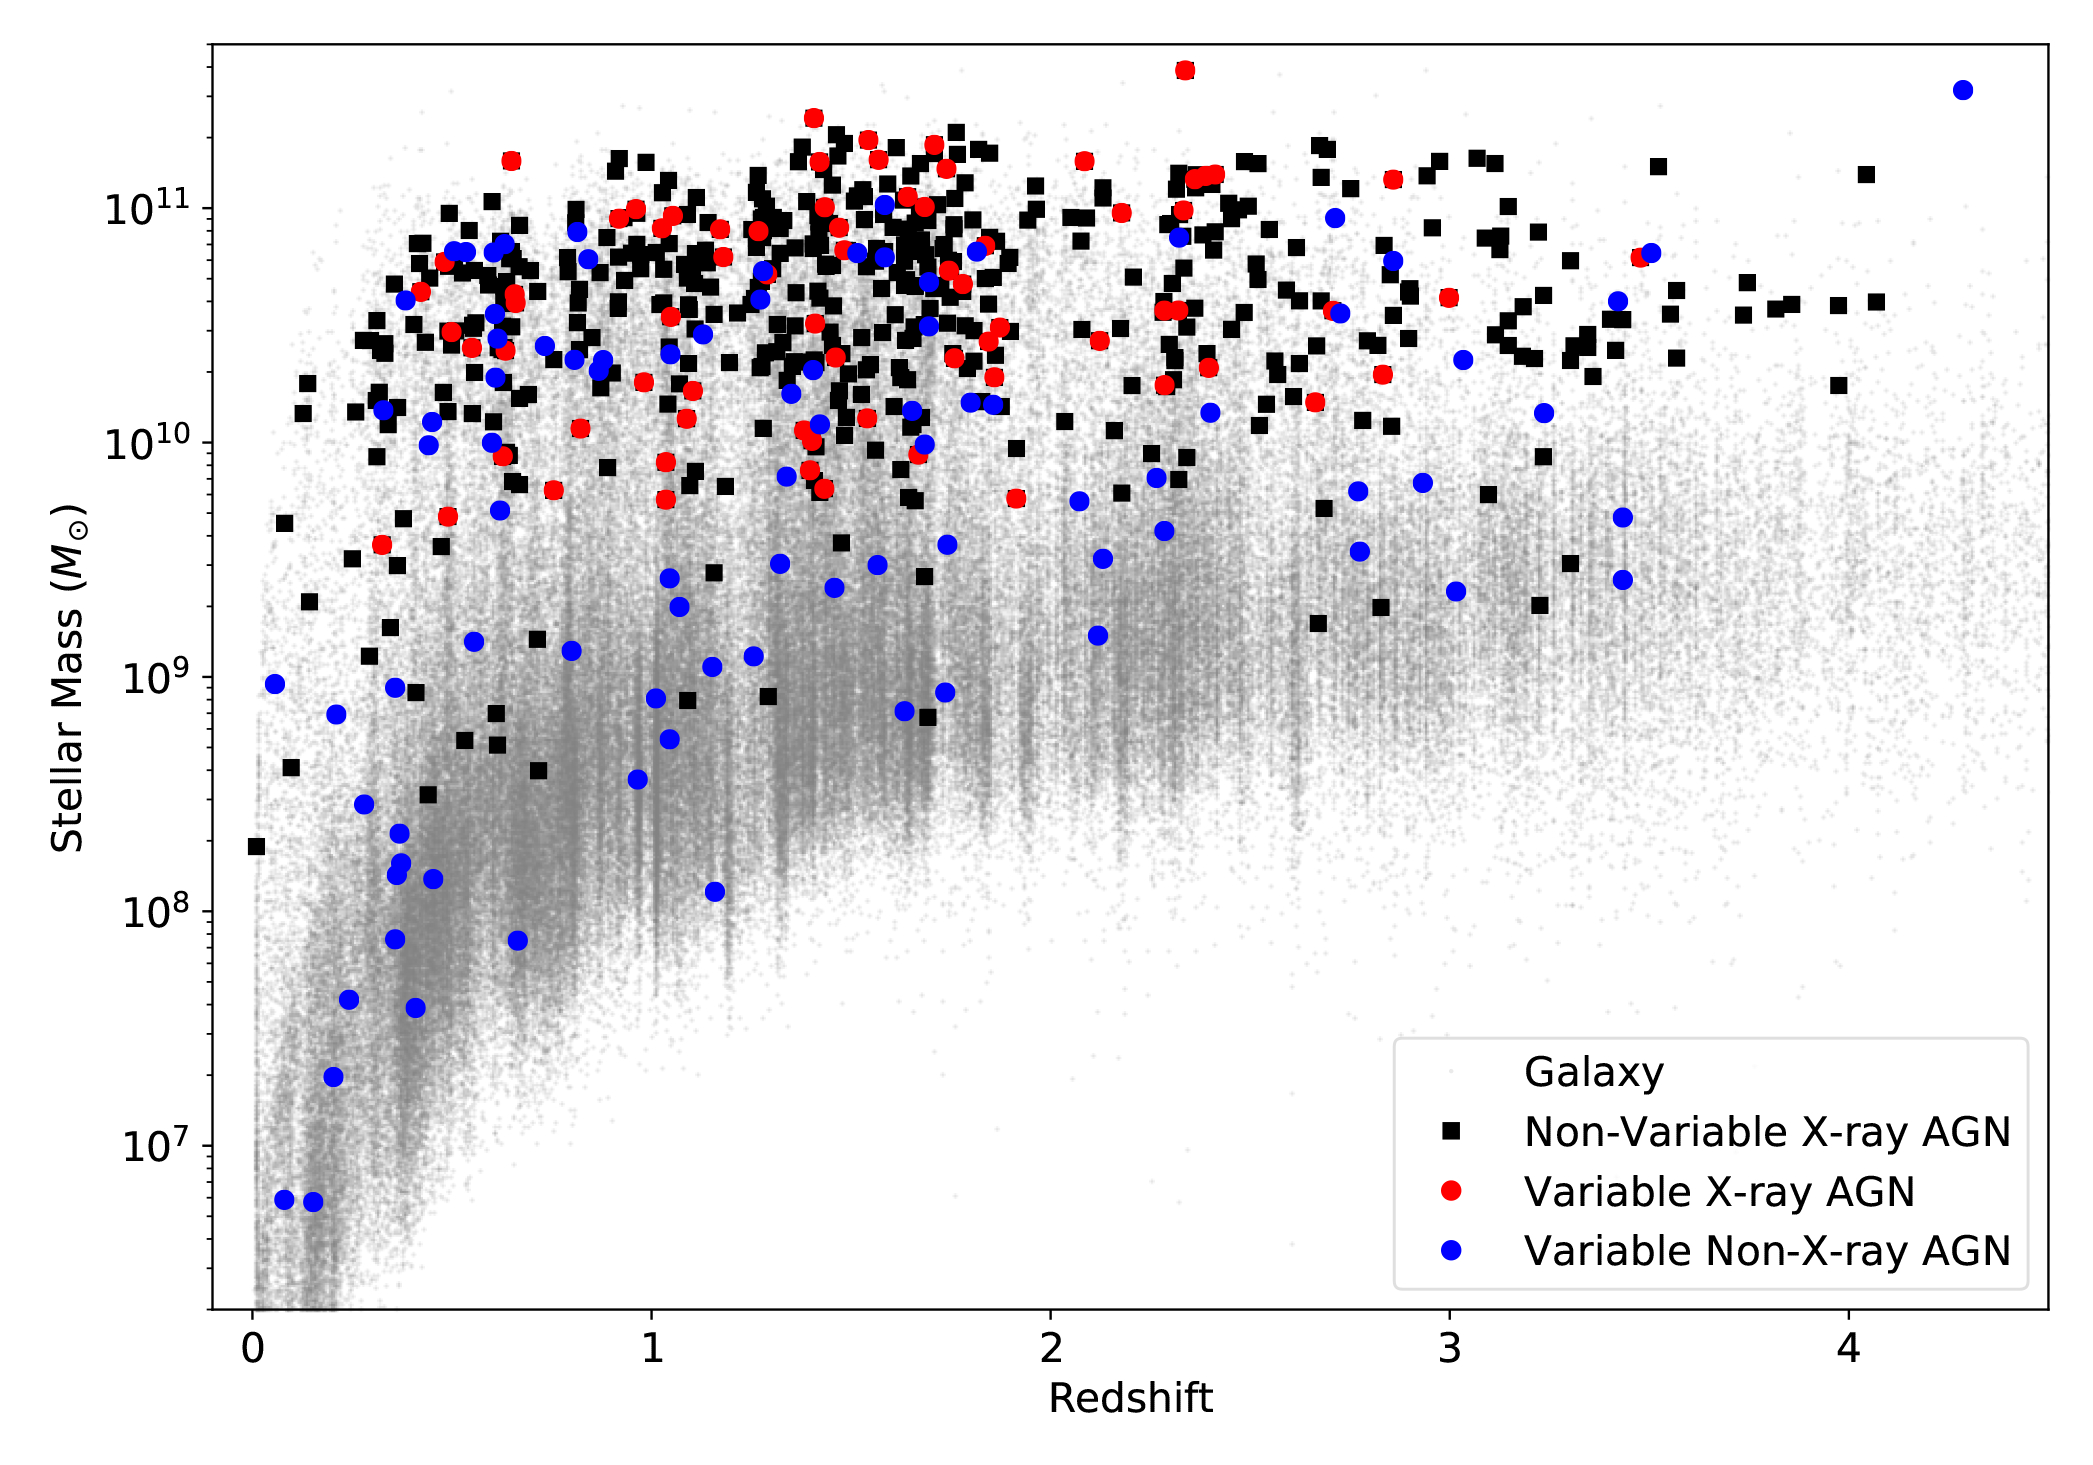
Figure 2: Host galaxy stellar mass as a function of redshift for the parent galaxy sample (grey points) with the three types of AGN highlighted: X-ray only selected (black), X-ray & variability selected (red) and variability only selected (blue). Figure 7 in today’s paper.
X-ray selection techniques are generally based on a simple X-ray luminosity cut. Thus, the X—ray only sample selected will biased towards identifying the brightest AGN. Being bright is also much easier when the central black hole powering the AGN has a large supply of gas, is it more massive than most, or both. So, it is reassuring to see an overlap of 42% between the X-ray & variability selected AGN samples. Not only does this novel technique identify the known AGN but figure 2 shows that X-ray & variability selected AGN are found in predominately high mass galaxies across all redshifts, and figure 3 shows they have a generally larger X-ray luminosity.
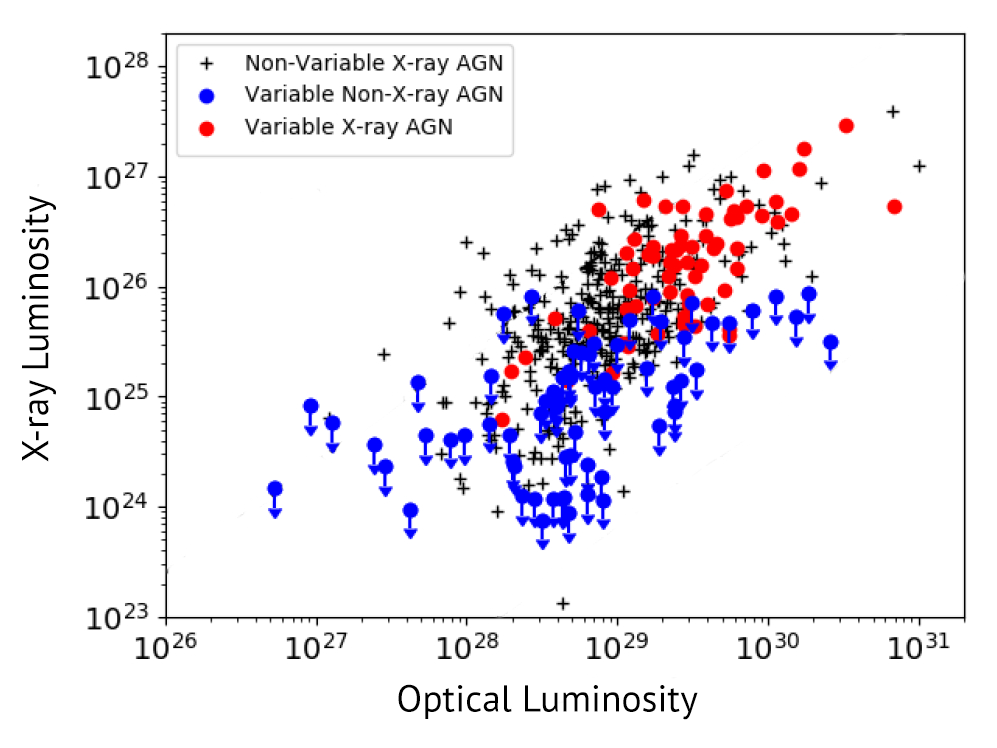
Figure 3: X-ray luminosity against optical luminosity for the three types of AGN: X-ray only selected (black), X-ray & variability selected (red) and variability only selected (blue). Adapted from figure 8 in today’s paper.
With the reassurance that the X-ray comparison gives us, the authors then go on to interrogate the more interesting population, the variability-only selected AGN. These AGN are found throughout the mass distribution but in particular, figure 2 highlights they are the only population found in the lowest mass galaxies across all redshifts. Furthermore, figure 3 shows quite a stark divide in AGN X-ray luminosity. Variability only selected AGN are found in host galaxies with much lower X-ray emission than there X-ray selected counterparts. Thus, the authors conclude that this NIR-variability selection technique can be used to detect AGN typically missed by other selection techniques including those with low-luminosity or galaxies whose central black hole is obscured by gas and dust.
Conventional selection techniques all have their own inherent biases which limit our ability to capture the full extent of the AGN population. Today’s work is important as it has highlighted how to harness an AGN’s twinkle to identify underrepresented populations. A more accurate understanding of where AGN reside is crucial to better understanding what triggers them, how they affect their host galaxies and the evolution of galaxies in general.
Author