Title: A Large Population of Obscured AGN in Disguise as Low Luminosity AGN in Chandra Deep Field South
Authors: Erini Lambrides, Marco Chiaberge, Timothy Heckman, Roberto Gilli, Fabio Vito and Colin Norman
First Author’s Institution: Department of Physics & Astronomy, Johns Hopkins University, USA
Status: Submitted to the Astrophysical Journal, open access on arXiv
Light emanating from within a host galaxy travels a huge distance to reach an observer. Along its path, the photons can encounter obstacles which change their wavelength or diminish the total intensity. Depending on the host galaxy’s orientation relative to Earth, said emission could even be impeded by material contained within the galaxy. This can make the identification and classification of the photon’s source much harder. Models predict that there are a huge number of active galactic nuclei (AGN) that grow behind dense screens of gas and dust that surround its host galaxy. Deep X-ray surveys are thought to produce the most complete and unbiased surveys of the AGN population but we are yet to observationally confirm the high predicted fraction of these obscured AGN. Today’s paper re-evaluated such a deep X-ray survey containing a large sample of AGN in the Chandra Deep Field South (CDFS) and investigated whether the lower luminosity sources are, in fact, bright sources hidden behind larger amounts of obscuring material than previously thought.
The original study contains approximately 500 X-ray selected AGN in the CDFS at redshifts above 0.5. For each detection, the original study calculated an estimate of the column density – a quantity describing the likely density of gas and dust around the galaxy that impedes photons travelling between source and observer. Using the column density of each AGN, today’s authors corrected the original observations and produced an intrinsic X-ray luminosity. Assuming the original study calculated the column density correctly then this intrinsic X-ray luminosity should make all the AGN in the sample appear completely un-obscured. Alongside this, they gathered mid-IR (6 and 24µm) and optical emission line data which can be used to describe other aspects of the AGN’s behaviour.
Tales of the Un-obscured
In an AGN, the observed X-ray emission is absorbed by material in the surrounding torus. This is then re-emitted at the 6 µm, mid-IR, wavelength by the torus. Assuming the original study correctly calculated the column density, we would expect these AGN to show a direct correlation between X-ray and mid-IR luminosity. However, there are a large number of AGN that have a much lower intrinsic X-ray luminosity for their torus luminosity, known as a ‘mid-IR excess’. In addition, 90% of these AGN are found in the faintest group of observations. Whilst this suggests that these faint AGN could be heavily obscured, there are a number of other possible explanations for why lower luminosity AGN have a mid-IR excess.
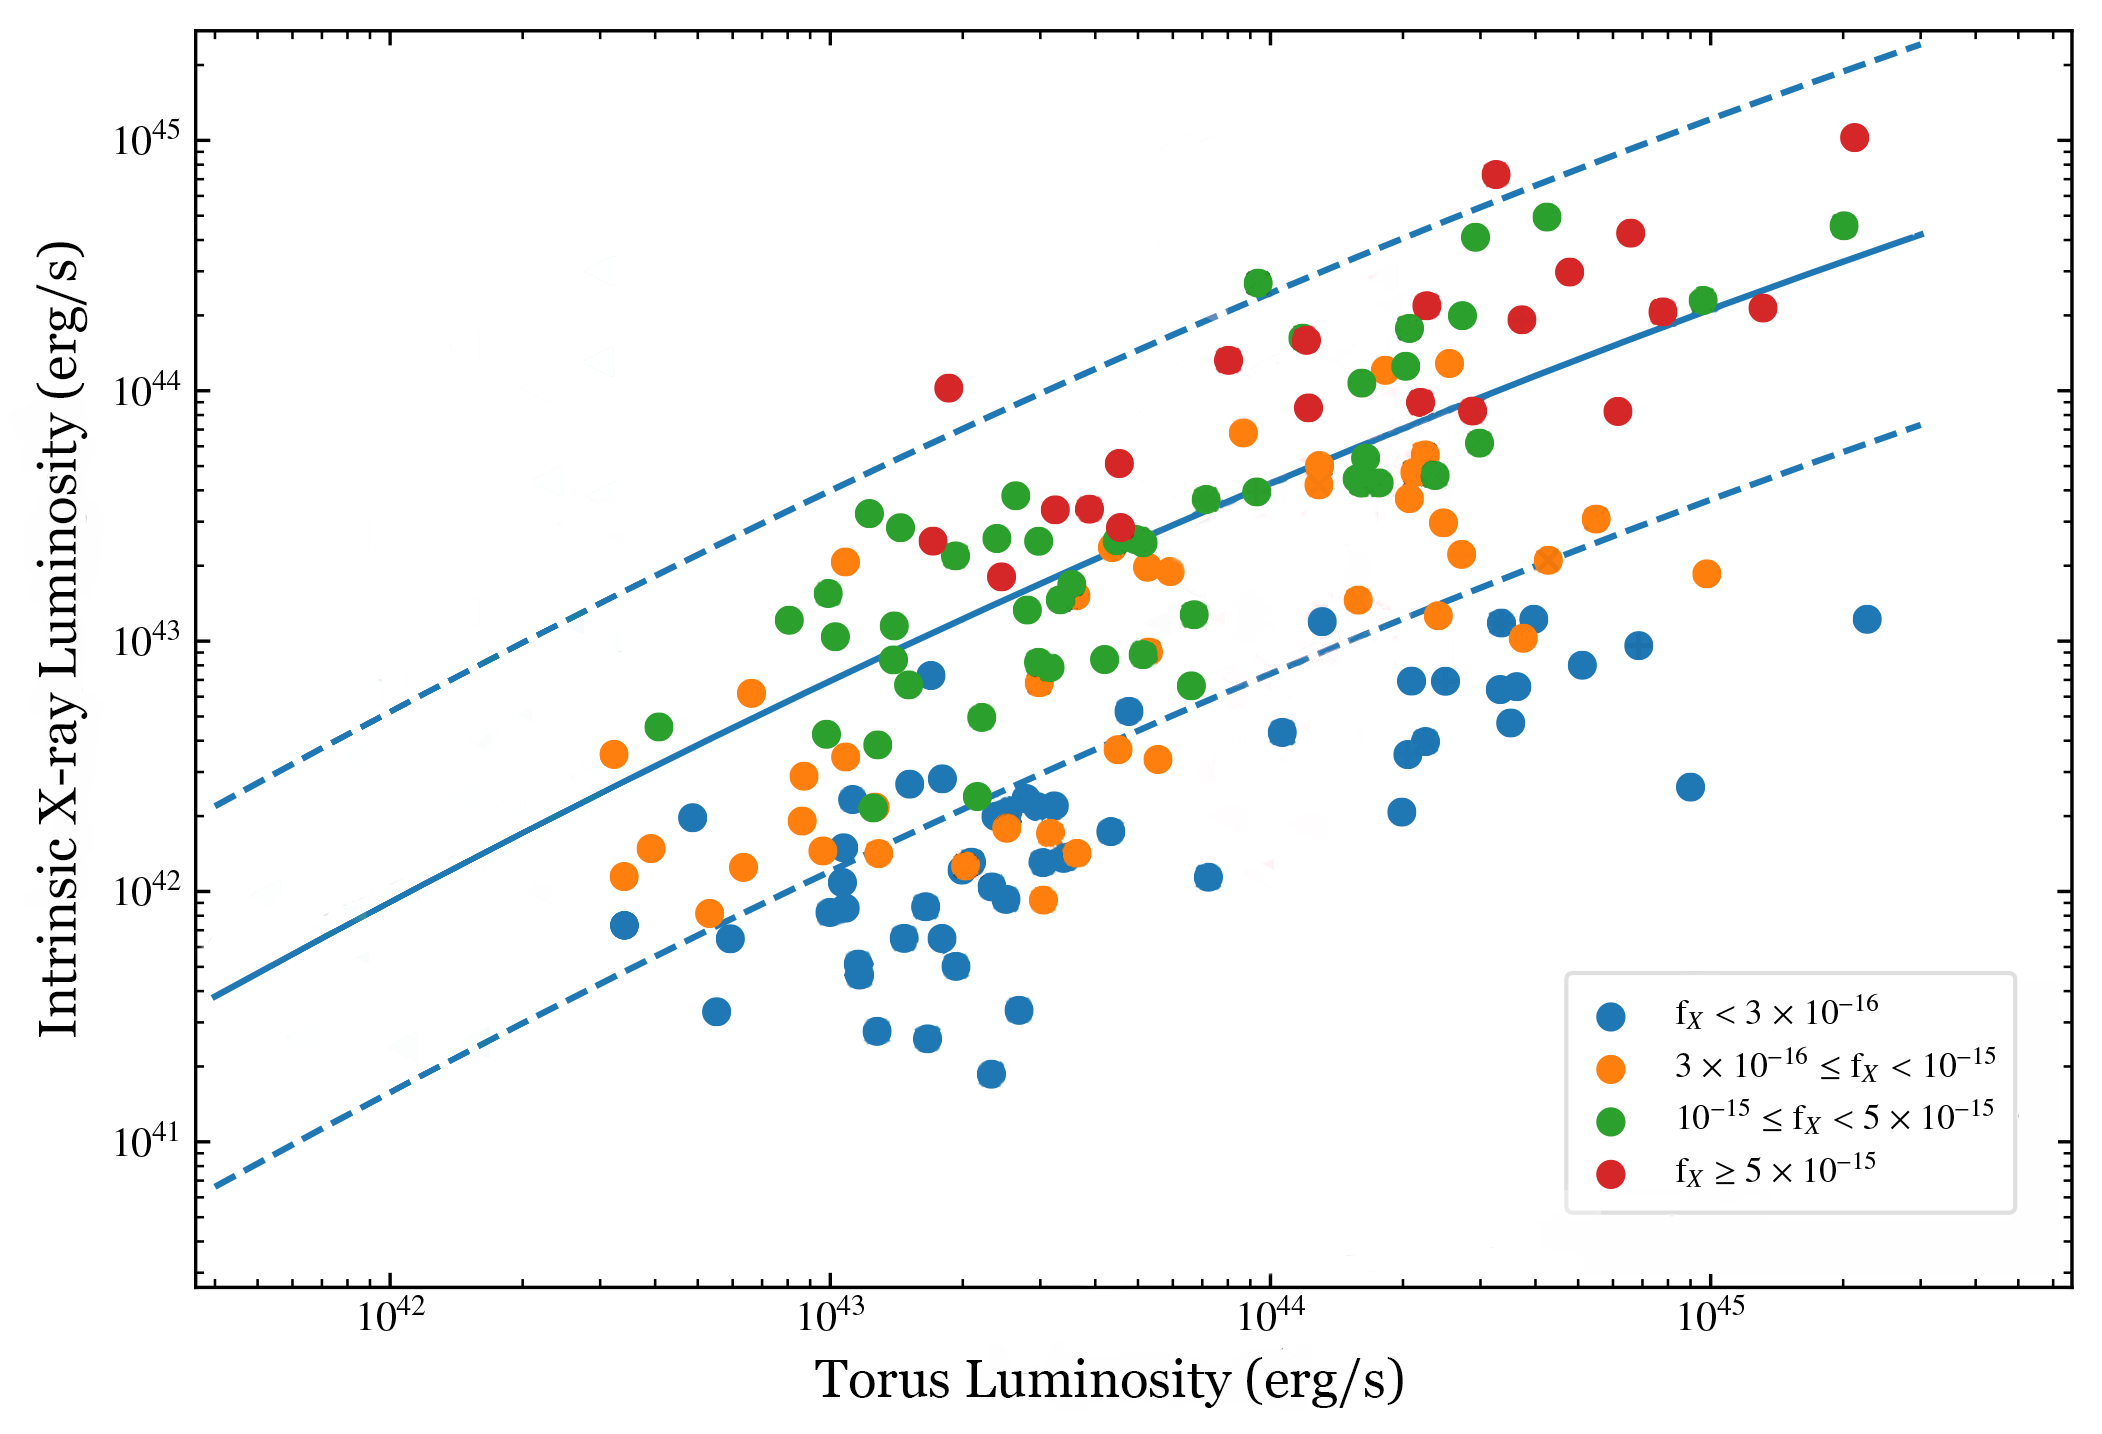
Figure 1: Comparing the intrinsic X-ray luminosity of an AGN against its torus luminosity. All of the AGN are coloured based on the group their observed flux falls into, with the faintest being blue ranging up to the most luminous in red. The dashed blue line highlights the region we expect an un-obscured AGN to lie within. Adapted from figure 4 in today’s paper.
One possibility is simply that the intrinsic X-ray luminosity is correct and we are observing an un-obscured AGN with genuinely lower emission than expected. In figure 2, the authors compare the intrinsic luminosity to the [OIII] optical emission line luminosity – an independent measure of AGN activity – to see whether these AGN are intrinsically faint. Not only do the faint AGN (blue points) sit outside the region that suggests they are un-obscured, but they appear to be much more active than expected for their intrinsic X-ray luminosity and also occupy a similar region to obscured AGN from a previous study. So, these faint AGN don’t have an intrinsically lower activity, but they do behave similarly to obscured AGN.
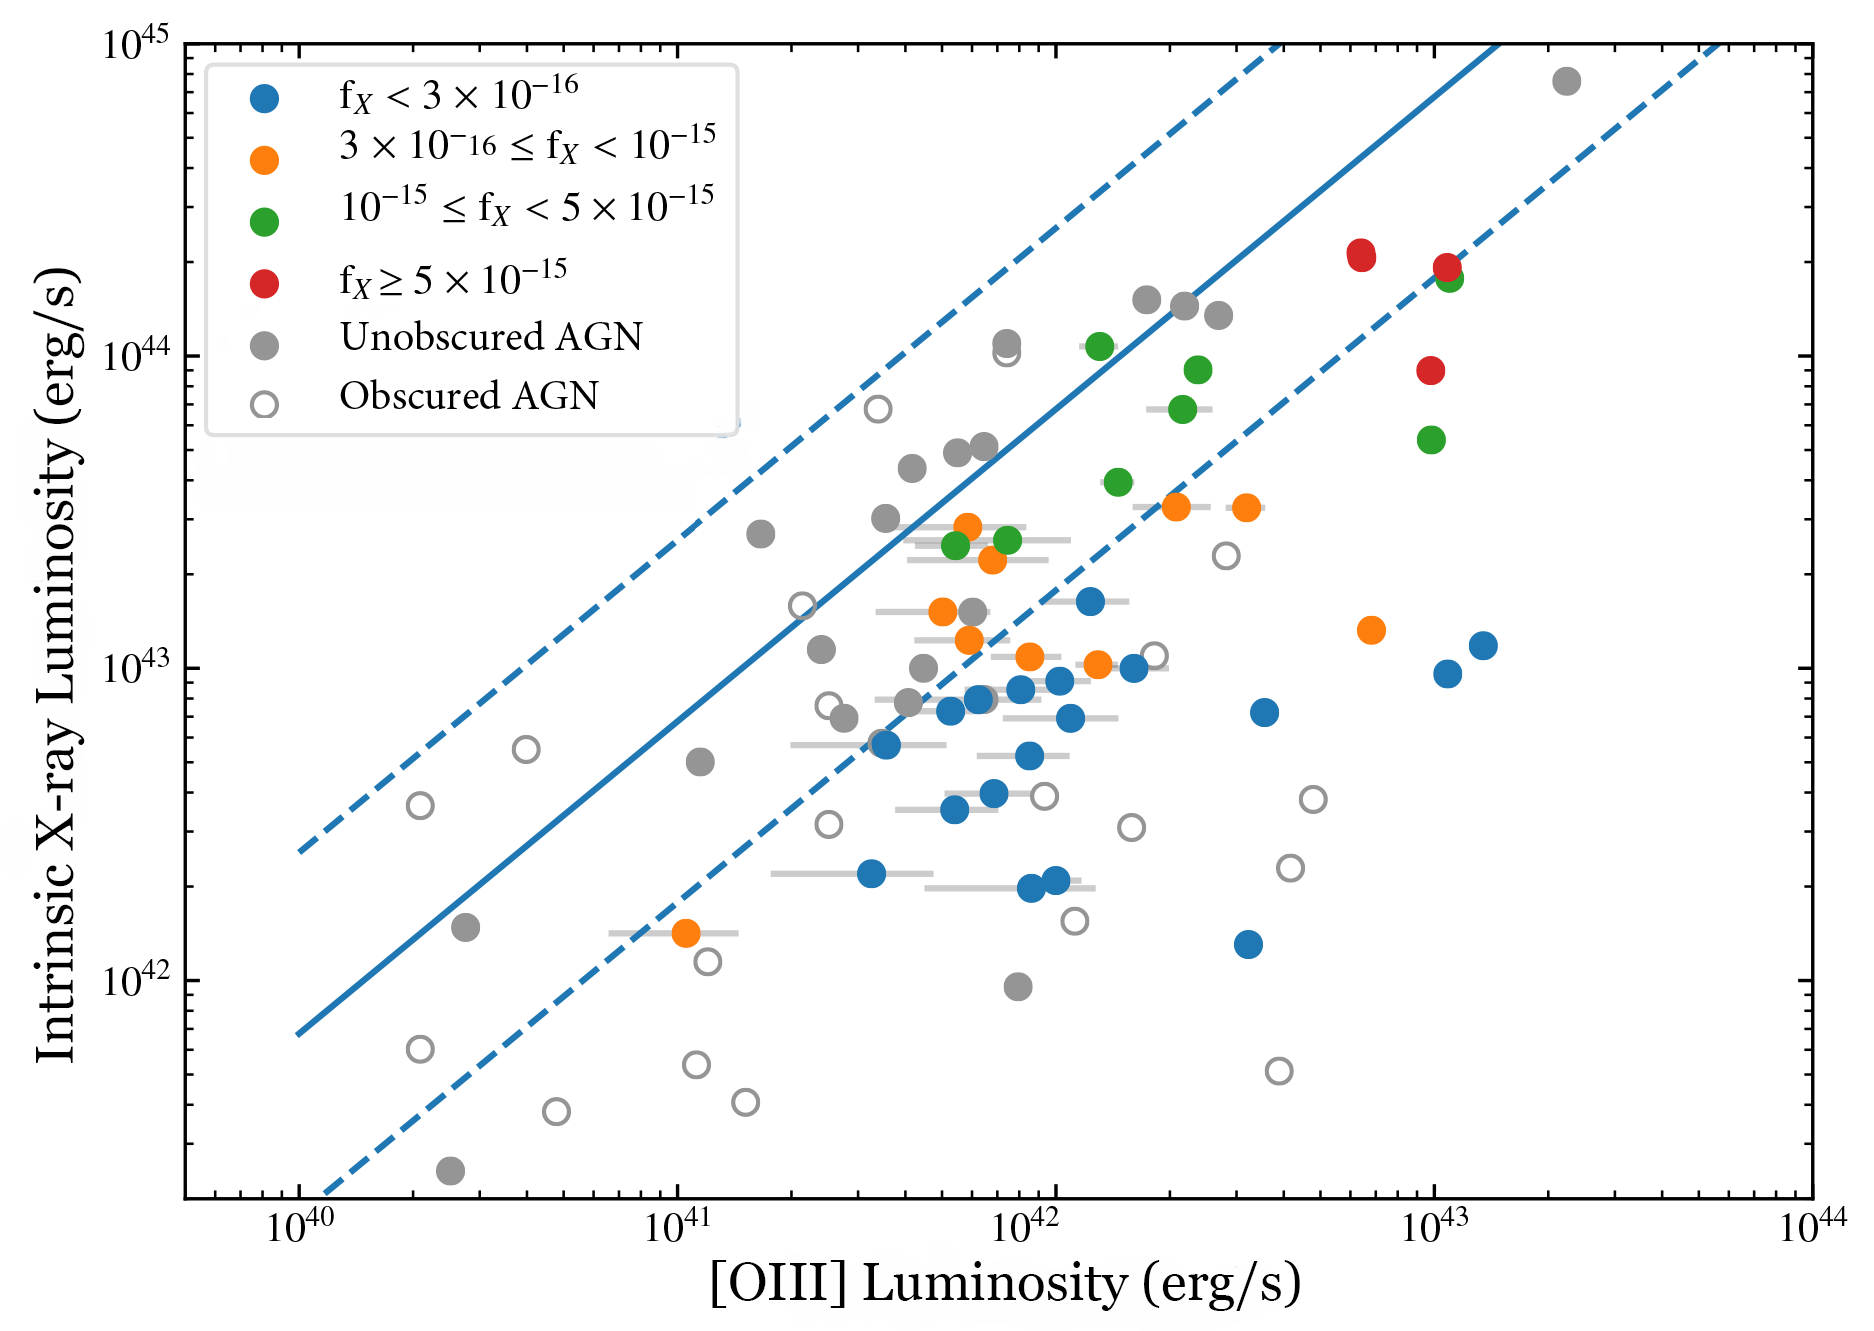
Figure 2: Comparing the intrinsic X-ray luminosity with the luminosity of the [OIII] optical emission line – an independent measure of AGN power. As with figure 1, the AGN are coloured by their observed X-ray flux and we expect un-obscured AGN to lie within the dashed blue lines. There are also a number of AGN from a separate study: filled, grey points are un-obscured AGN and the hollow, grey points are obscured AGN. Adapted from figure 5 in today’s paper.
If the AGN aren’t less active then perhaps a non-AGN emission component, such as star formation (SF), could be causing the mid-IR excess. 24 µm emission is commonly used to trace star formation as warm dust associated with high-mass star-forming regions emits strongly at this wavelength. However, 24 µm emission can also be associated with activity from un-obscured AGN. Figure 3 shows that whilst many of these AGN don’t sit within the un-obscured region, crucially none of them are any way near the SF-driven relationship. In particular, the faint AGN (highlighted with a red circle) occupy this in-between area where they don’t appear to behave like un-obscured AGN nor are they all explained by star formation.
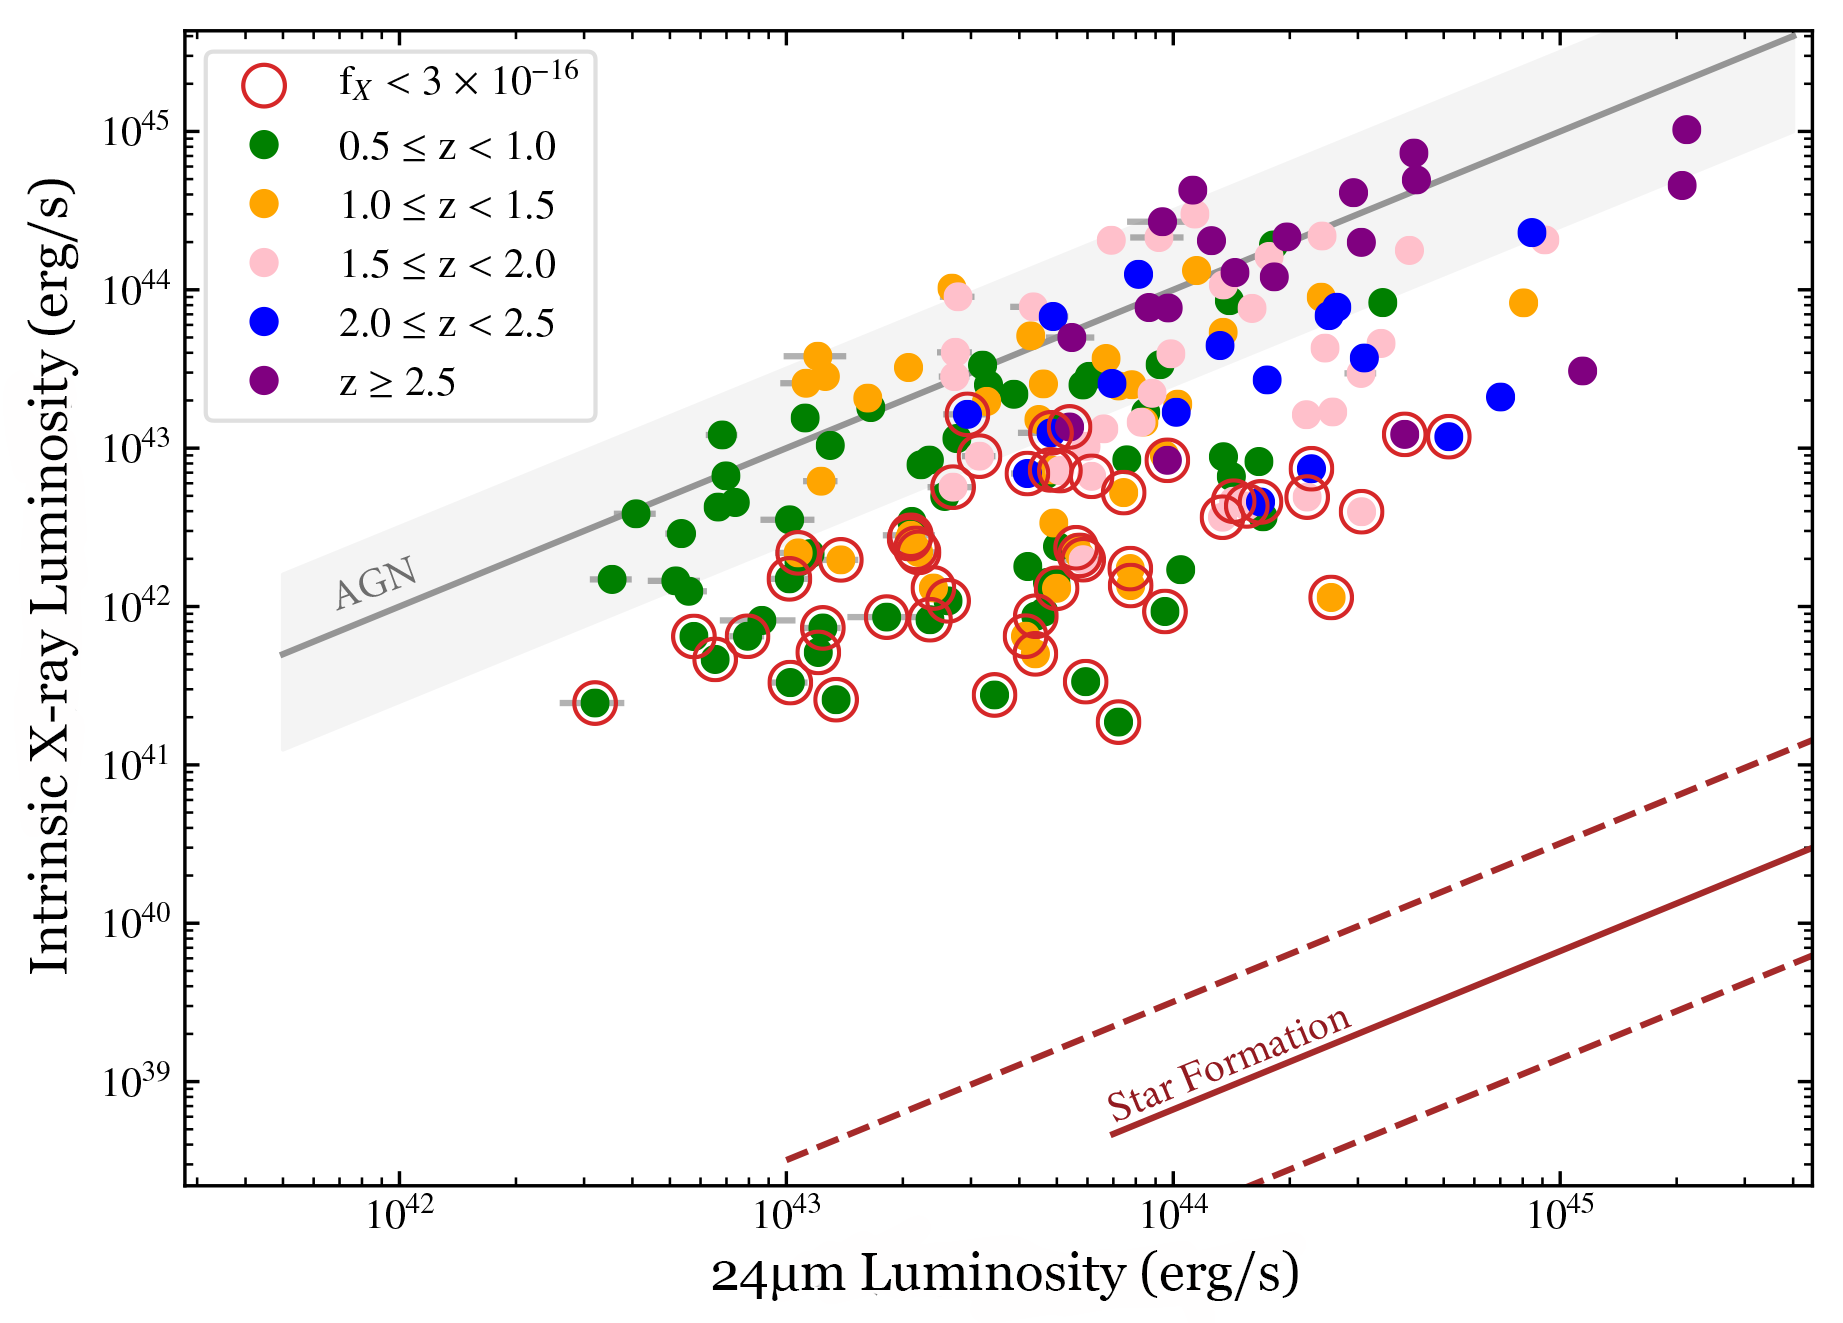
Figure 3: Comparing the intrinsic X-ray luminosity against the 24 µm luminosity. All of the AGN are coloured based on their redshift (as this determined the instrument recording 24 µm emission) but the lowest flux AGN (previously blue in figures 1 & 2) are highlighted with red circles. Objects with 24 µm emission largely driven by the AGN are found in the grey region, whilst those driven by star formation would be found within the red region. Adapted from figure 6 in today’s paper.
Given that this mid-IR excess cannot be explained by a less active AGN or star-formation, the authors turn to their initial hypothesis: these faint AGN are more heavily obscured than the original study proposed. In figure 4 the authors investigated how different levels of obscuration could help describe the observations. Most of the faint AGN (blue points) are consistent with column densities at least 10 times larger than calculated in the original study. Such an increase in obscuration would see a similarly sized increase in intrinsic X-ray luminosity and account for the mid-IR excess. Thus, the authors conclude that they have discovered a new sample of highly obscured AGN.
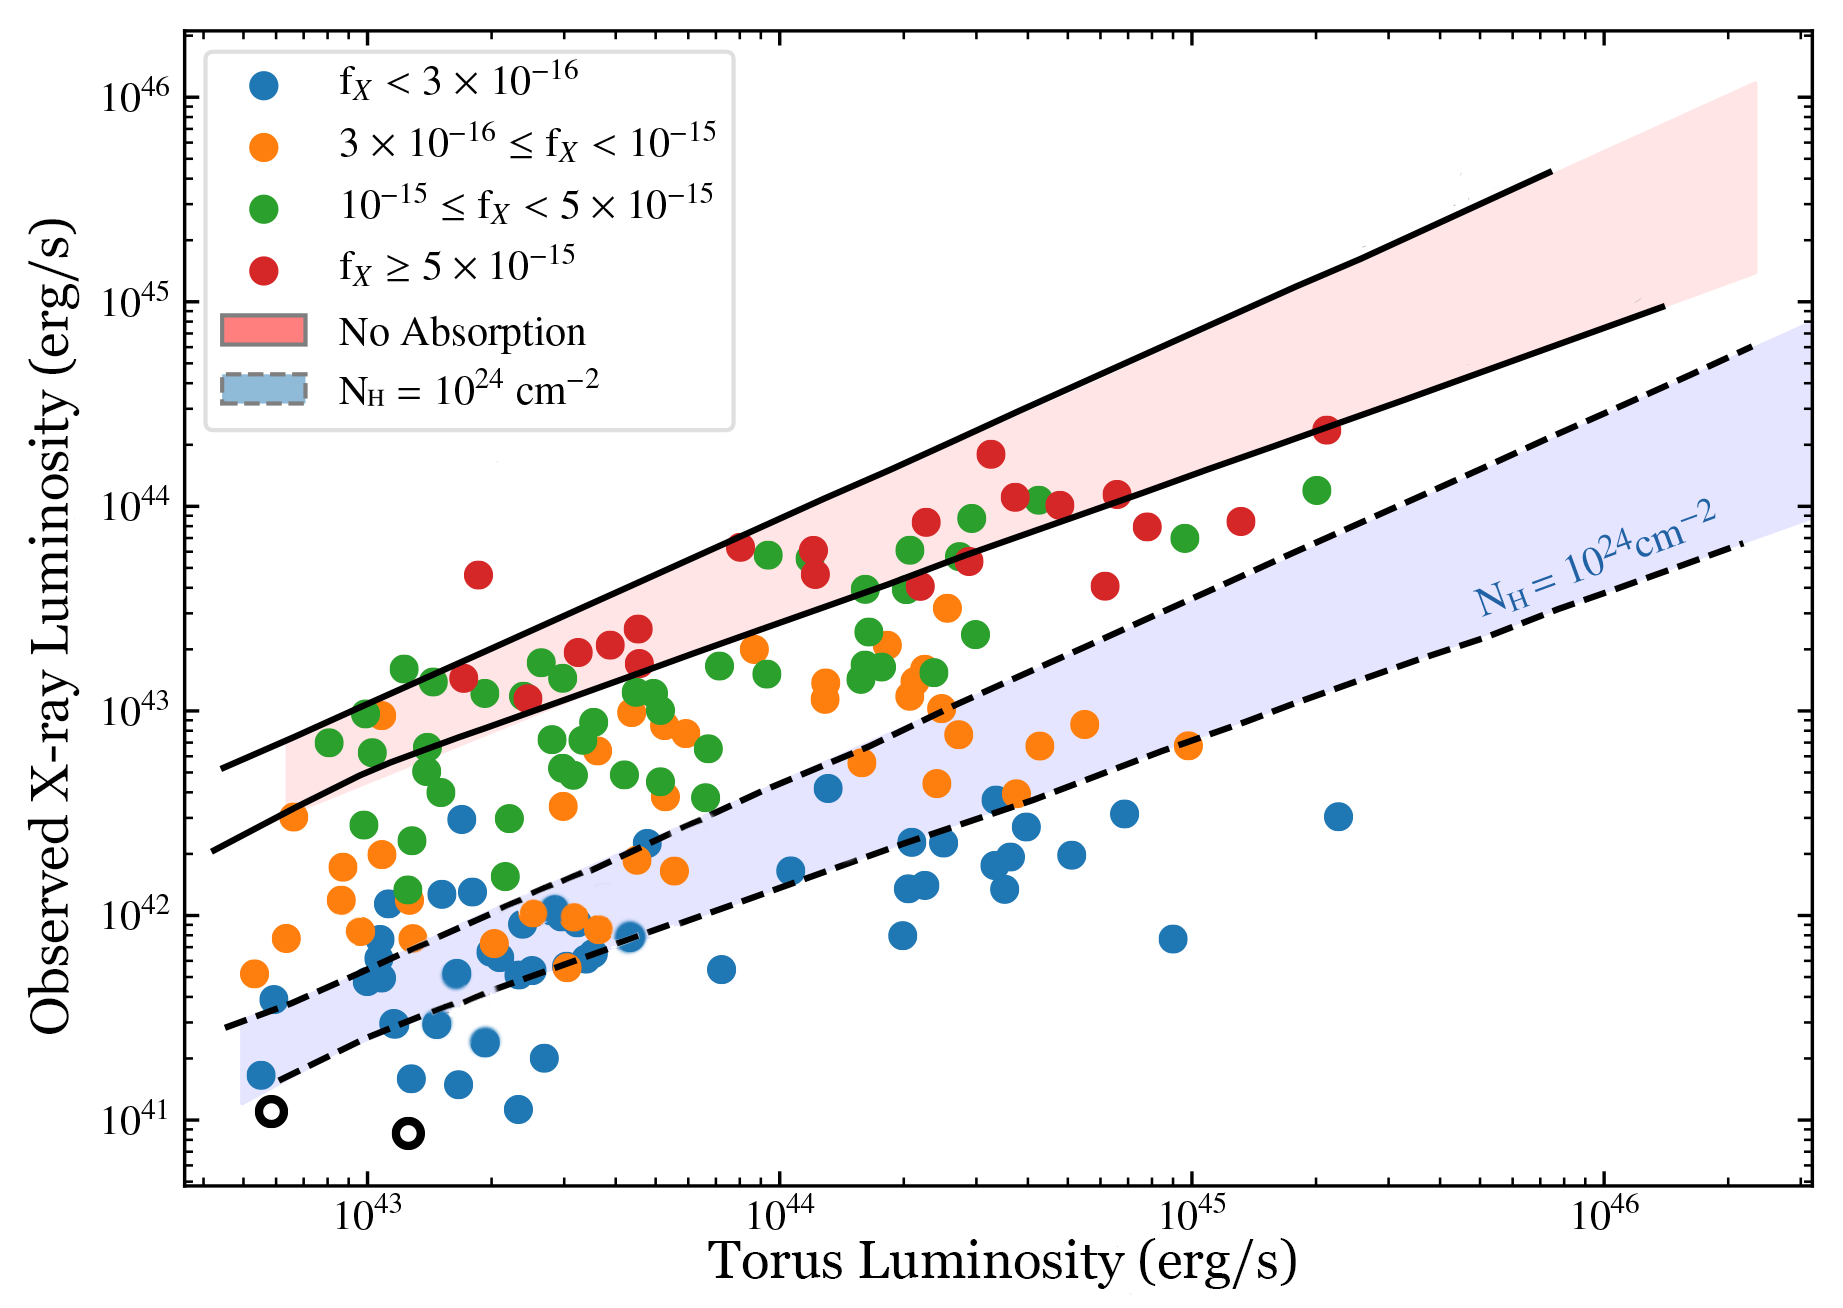
Figure 4: Similar to figure 1 but instead comparing the observed X-ray luminosity with the torus luminosity. Overlain on these points are regions within we would expect to find AGN of varying levels of obscuration. Un-obscured AGN are found within the red region, more heavily obscured AGN are found within the blue region. Adapted from figure 10 in today’s paper.
Today’s paper is important as it provides a new successful approach to probing a fainter luminosity population than previously investigated in the field. In addition, assuming that all the newly identified obscured AGN have an increased column density, then the authors find that estimations of the space density of obscured AGN increases between 40% – 50%, depending on redshift. Such an increase helps close gap between the observed and predicted densities of obscured AGN in the Universe.
Author