Authors: R. K. Cochrane, P. N. Best, I. Smail, E. Ibar, C. Cheng, A. M. Swinbank, J. Molina, D. Sobral, U. Dudzevičiūtė
First Author’s Institution: Harvard-Smithsonian Center for Astrophysics, USA & SUPA, Institute for Astronomy, Royal Observatory Edinburgh
Status: Published in Monthly Notices of the Royal Astronomical Society [closed access]
Most of the Universe’s star formation is hidden behind a smokescreen of dust, which absorbs and re-emits short wavelength light from hot, young stars to longer wavelengths. One extreme type of galaxy, dusty star-forming galaxies (DSFGs), is responsible for a significant portion of total cosmic star formation. DSFGs have some of the highest rates of star formation, in the 100s – 1000s M☉/year compared to our own Milky Way Galaxy, which forms stars at a moderate 1-2 M☉/year.
How these huge bursts of star formation are fueled remains somewhat fuzzy. It’s challenging to discern detailed physical processes when all you have to look at is an unresolved blob of dust very far away. Like a TV show crime scene investigator going “sharpen!” and magically finding the clue in what once was a blurry image, to investigate the mechanisms of extreme star formation, we need a more detailed, spatially resolved image of a galaxy.
SHiZELS-14, a Shining Starburst
The authors of today’s paper use spatially resolved observations in multiple wavelengths to zoom in on the star formation in one galaxy, called SHiZELS-14. This galaxy is part of the High-Redshift(Z) Emission Line Survey (HiZELS), which targets galaxies in fields with lots of archival observations that have H-alpha emission, a tracer of star formation. SHiZELS-14 is the brightest, most extended, most extreme source in the subsample of HiZELS galaxies that were followed up with detailed observations using the SINFONI instrument on the Very Large Telescope (VLT). At redshift z = 2.24, it is near the peak of both star formation and the prevalence of DSFGs in the Universe. Along with its high stellar mass (1011 M☉) and extreme star formation rate (~1000 M☉/year), it’s an ideal galaxy to take a closer look at extreme starbursts.
Like Looking at a Skyscraper on the Moon
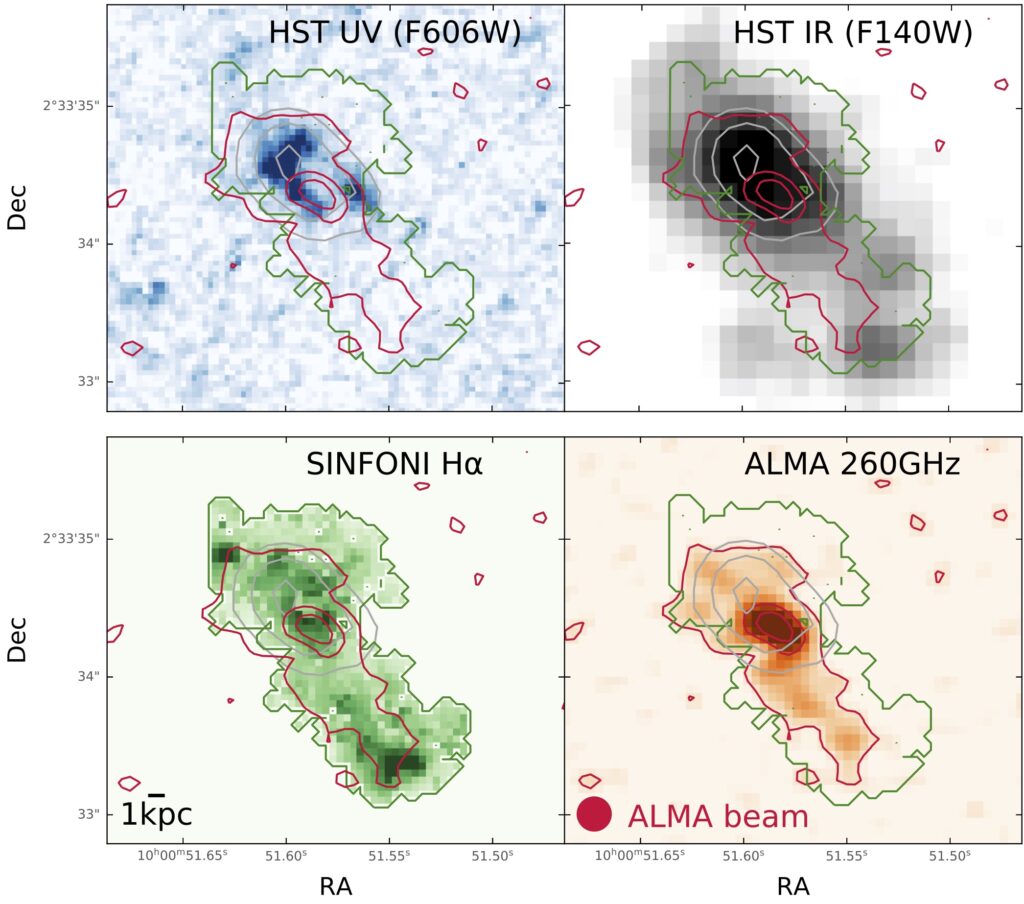
Combining our physical and empirical understanding of star formation in galaxies, astronomers can measure star formation using a range of wavelength regimes. These different regimes probe different physics: either the emission from the stars themselves or their impact on the surrounding gas and dust. In general, short wavelengths (in the ultraviolet (UV) and optical) capture emission directly from the forming stars, while longer wavelengths (in the FIR to radio) capture emission from the dust enshrouding those forming stars.
Cochrane et al. compiled data taken in four different wavelength regimes to combine information from four different star formation calibrators: rest-frame UV light from new stars, H-alpha emission from ionizing star forming regions, and rest-frame far-infrared emission and radio emission from heated dust around the stars.
With these data, the authors achieve 0.15 arcsec angular resolution, which is analogous to resolving a skyscraper on the Moon. In the galaxy rest frame, this means one data point for every 1 kiloparsec or so (our Milky Way Galaxy is about 30 kiloparsecs across). Once these data were precisely aligned to each other as shown in Figure 1, the authors compared the results.
Compact, Extended, and Full of Holes
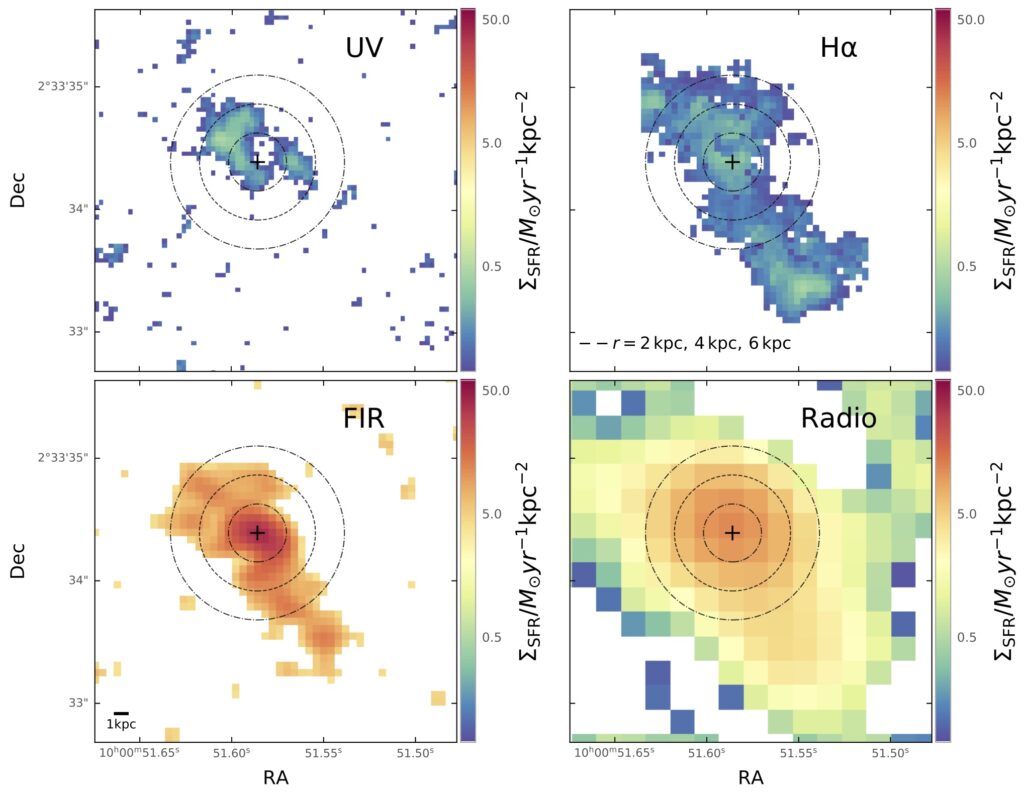
In general, it’s unsurprising to find star formation concentrated in the center of DSFGs, as the gas that fuels star formation gets funneled into the gravitational potential well at the galaxy’s nucleus. It’s also unsurprising to find extended star formation away from the nucleus of a DSFG, as clusters of stars form from gas throughout the disk of the galaxy. But, what the authors found for SHiZELS-14 is a bit more uncommon — both compact and extended star formation (Figure 2).
Beyond the spatially resolved star formation information, the authors derived properties related to the gas, stellar, and dust content by fitting the photometric data points to theoretical and empirical galaxy models. The H-alpha emission line data also allowed the authors to map the galaxy’s velocity field. Combining all this information, the authors then pieced together the star formation history of the galaxy and inferred the origin of its starburst activity. SHiZEL-14’s irregular, extended star formation, disordered shape and velocity field, and extreme SFR suggests we’re looking at an ongoing merger!
This distribution of starburst activity aligns well with what astronomers have found in galaxy merger simulations, like the study covered in this Astrobite. Unlike simulations that can trace entire galaxy mergers, observations only catch a snapshot in a galaxy’s evolution. Therefore, SHiZELS-14 is particularly intriguing, as we’re catching it in its relatively short-lived mid-merger stage!
Not all Star Formation Calibrators are Created Equal
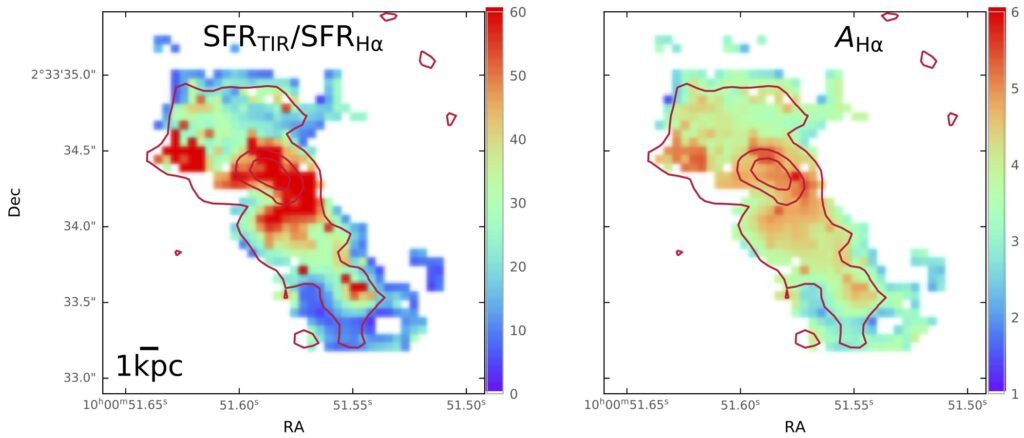
Although together the four wavelength regimes paint a detailed portrait of SHiZELS-14 and its star formation, alone they can miss some of the picture. While dust emission and H-alpha both confirm a high SFR of ~1000 M☉/year, shorter wavelength observations indicate a SFR that is orders of magnitude lower. As Figure 3 demonstrates, this is mainly due to the dimming and reddening effects of dust and its variation across the galaxy. The takeaway: shorter wavelengths provide a biased view of star formation due to dust, and it’s important to account for this bias when measuring a galaxy’s SFR (see this related Astrobite).
SHiZELS-14 is a striking example of an extremely star-forming, dusty galaxy. This new, resolved view of the galaxy not only suggests its starburst activity is fueled by an ongoing merger, but also provides an important reminder: don’t forget about dust!
Astrobite edited by Katya Gozman
Featured image credit: Adapted from Wikipedia/NOAA George E. Marsh Album
I’m very impressed with the care, detail, and accuracy this Astrobites project presents the often very complex Cosmological topics, with reference to state of the art progress in the scientific literature. Thank you very much.