Authors: Javier Sanchez, Ismael Mendoza, David P. Kirkby, and Patricia R. Burchat for the LSST Dark Energy Science Collaboration
First Author’s Institution: Fermi National Accelerator Laboratory, Batavia IL 60510, USA
Status: Submitted to JCAP [closed access]
The next generation of astronomical surveys are going to be some of the most powerful and extensive probes of dark energy ever made, and the Vera Rubin Observatory’s (VRO) Legacy Survey of Space and Time (LSST) is no exception. With an 8.4 meter mirror and 3.2 gigapixel camera, it’s set to take about 800 images per night covering 10 square degrees every 30 seconds. With the survey’s amazing coverage and depth, it will capture images of many galaxies and clusters that can help us demystify the cosmological structure of the universe.
Short Detours on the Cosmic Highway
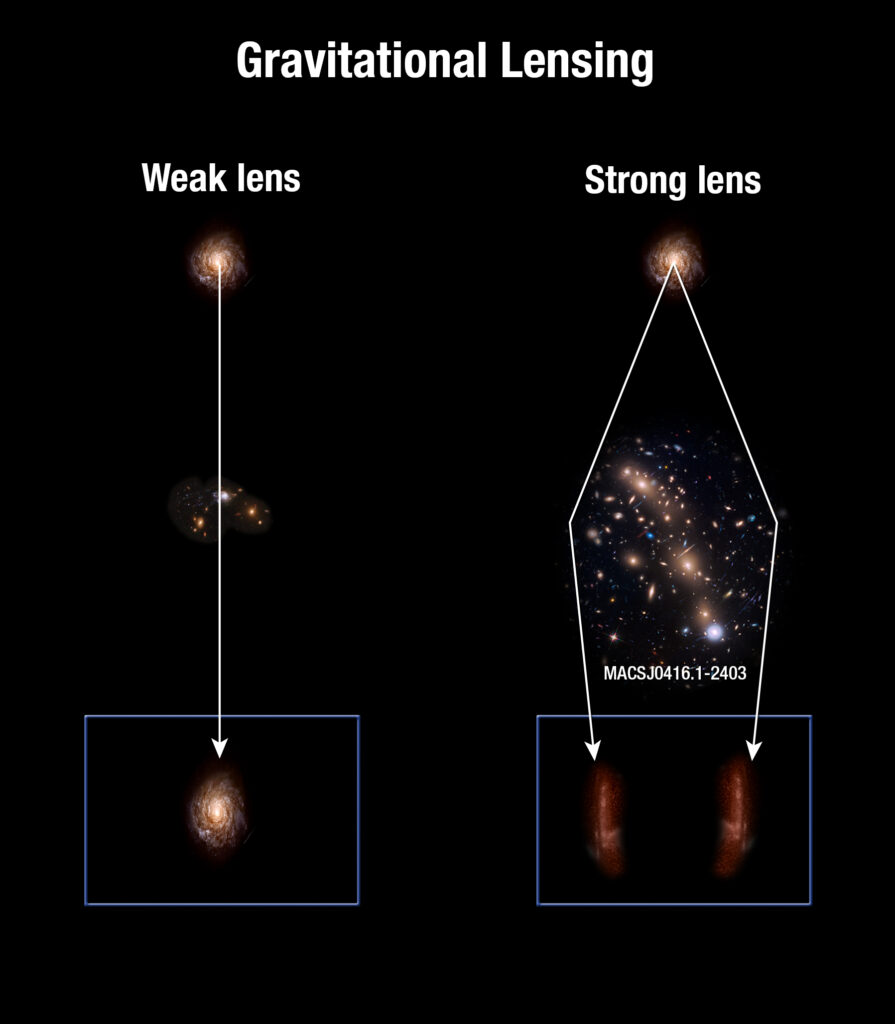
One of the major probes of dark energy that nature provides us with is weak gravitational lensing. Gravitational lensing is an effect caused by the bending of spacetime around massive clusters, distorting and bending the light from background objects. Depending on the geometry and mass distribution of the lens and source, sometimes this can cause intense distortions of the source, creating multiple images of it and spreading out its light into giant arcs. This is called strong lensing (see my last Astrobite discussing this in more detail!). But more often, we see smaller distortions of many galaxies, since finding large clusters in the path of background sources isn’t common. These distortions are observed as cosmic shear, or how stretched out your galaxy is, and convergence, or how magnified it is. But these effects are so small that we would not be able to statistically quantify it if we were looking at just one galaxy. Since most galaxies aren’t intrinsically completely circular, their measured ellipticity is actually a measure of both their intrinsic ellipticity and ellipticity from weak lensing shear. But the shearing effect is much weaker than the intrinsic ellipticity, so we must look at a large sample of galaxies to quantify this effect. Since galaxies are also generally randomly oriented in a field, we need to look at a group of them to see any noticeable systematic alignment caused by lensing. Weak lensing enables us to measure how much matter there is between us and the light source, which we can use to constrain properties of cosmological models.
Lost in the Woods
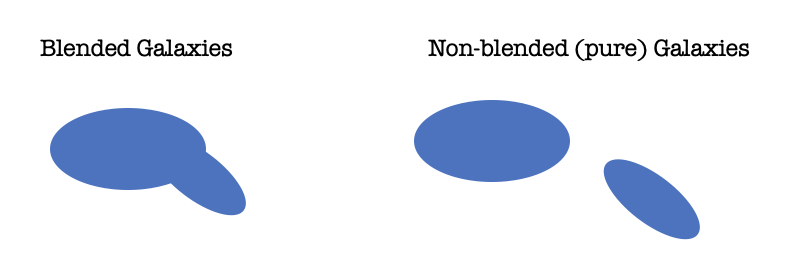
Weak lensing is a great tool, but since these galaxies are so far away, we expect many images to contain galaxies that are blended together. If you stand in a forest right in front of a pine tree, you can easily take a picture of the whole pine tree. But the farther away you walk, the more trees get in your way, not to mention all the other plants and animals. Every step away makes it harder to distinguish the original pine from all the other trees in the forest. The same effect happens in deep astronomical images: if you’re looking far enough away, the light from two (or more!) galaxies can blend together and they can look like one blob, with intervening stars sometimes also photo-bombing your image. This makes it very difficult for astronomers to measure the amount of light coming from individual galaxies and how much their shape is distorted (sheared) by weak lensing.
Fishing for Information
With the terabytes of information that a survey like LSST will collect each night, it’s important for astronomers to understand what kinds of effects will bias their data and create a robust procedure for correcting it. In the case of today’s paper, while the authors don’t have actual imaging data to work with while the telescope is being built, they instead simulate what images from different telescopes will look like and use that to test the effects of blended sources on cosmic shear measurements. More specifically, they simulate images from the Dark Energy Survey (DES), the Hyper-Suprime Cam Subaru Strategic Program (HSC-SSP), and the LSST and assess the impact that blending has on 1) statistical sensitivity and 2) pixel-noise bias, using a method called the Fisher matrix. I’ll spare you the complicated math and statistics involved, but the key idea is that this is a matrix representing how much information a given observable such as galaxy radius or shape carries and how correlated parameters of a model are (e.g., does the half-light radius of a galaxy change if you vary the flux? What about the shape?). If you model galaxies based on properties such as shape and flux and know the uncertainties on your measurements, you can calculate the uncertainties on the values that go into your model (for example, if our model was the equation of a line, we can calculate uncertainties on the slope and intercept of the line from the Fisher matrix using the measurements and uncertainties of x and y).
One Galaxy, Two Galaxy,….Three Galaxy?
Using results from their Fisher analysis, the authors predicted the effective number density of all detectable galaxies whose shapes are measured perfectly for their simulated images, Neff (this is the statistical sensitivity of the survey). They also found the effective number density for high-purity (>98% of a galaxy’s flux is isolated from any other source) galaxies, Npureff. They found that only ~62% of galaxies in LSST will have high-purity, compared to ~74% in HSC and DES, highlighting that LSST is expected to find more blended galaxies than either of its two predecessors. This is because if we look at sources fainter than i=24 magnitude (24th magnitude object in the near infrared), we see a larger contribution from blended sources, suggesting that for a survey like LSST that can detect much fainter objects, it is important to develop algorithms that can resolve and “de-blend” images, or in other words, be able to correctly divide up the flux from pixels that share one or more source.
(not so) Pixel Perfect
The authors also test the effect of blending on pixel-noise bias on LSST images, which is Poisson noise that can come from galaxies or the sky background (think of the static you see in old TVs). They found that this bias depended not just on the shear, but also on how they calculated the shear of galaxies, and also that the bias increases with higher redshift, since you decrease the size of your galaxies and hence decrease the signal to noise ratio. Therefore, they found that they could not robustly estimate the noise bias effect on cosmic shear based on their simulations alone, and it will be important to develop techniques to remove this bias, even if just for isolated galaxies.
With the Rubin Observatory hopefully set to begin its ten year survey in a year, astronomers are working hard to predict the limitations of the instrument so that they can build software to mitigate potential effects of bias. Today’s paper showed us that for a deep survey like LSST, it will be very important to figure out how to de-blend overlapping galaxies, as this will affect the sensitivity of the survey and measurements we make while harnessing weak lensing to understand the cosmology of our universe.
Astrobite edited by Sumeet Kulkarni
Featured image credit: https://www.lsst.org/science