The Undergraduate Research series is where we feature the research that you’re doing. If you are an undergraduate that took part in an REU or similar astro research project and would like to share this on Astrobites, please check out our submission page for more details. We would also love to hear about your more general research experience!

Jake Jensen
Brigham Young University
This guest post was written by Jake Jensen. Jake Jensen is a senior undergraduate Astronomy student studying at Brigham Young University (BYU). He has been working on this research for the past year under Dr. Eric Hintz. He presented these results at AAS 237.
Using photometric filters to measure apparent magnitudes and color indices is a common way to approximate parameters of astrophysical objects. What you can infer depends on what part of the electromagnetic spectrum your instruments and filters are sensitive to and how wide that coverage is. The H-alpha narrow and wide filters are designed so the effective temperature and H-alpha spectral line equivalent width can be inferred from the star’s color index value. When we used these filters to make color-magnitude diagrams for the open star clusters H & Chi Persei, we found some strange features. In addition to seeing the main sequence of stars, as in the Hertzsprung-Russell diagram, we found a population of stars parallel to the main sequence. My research focused on figuring out exactly what these stars are.
Our initial color-magnitude diagrams had large error bars on our color index measurements since they only used a few nights of data. The diagrams may also have included background stars that are not part of the cluster. As open cluster stars in color-magnitude diagrams are assumed to be at approximately the same distance from us, background stars would be another possible explanation of this parallel population.
To reduce the size of our error bars, I obtained more observations for these clusters at BYU’s West Mountain Observatory between 2016 and 2018. I also observed another open cluster, NGC 752, to use its standard stars in my photometric measurements.
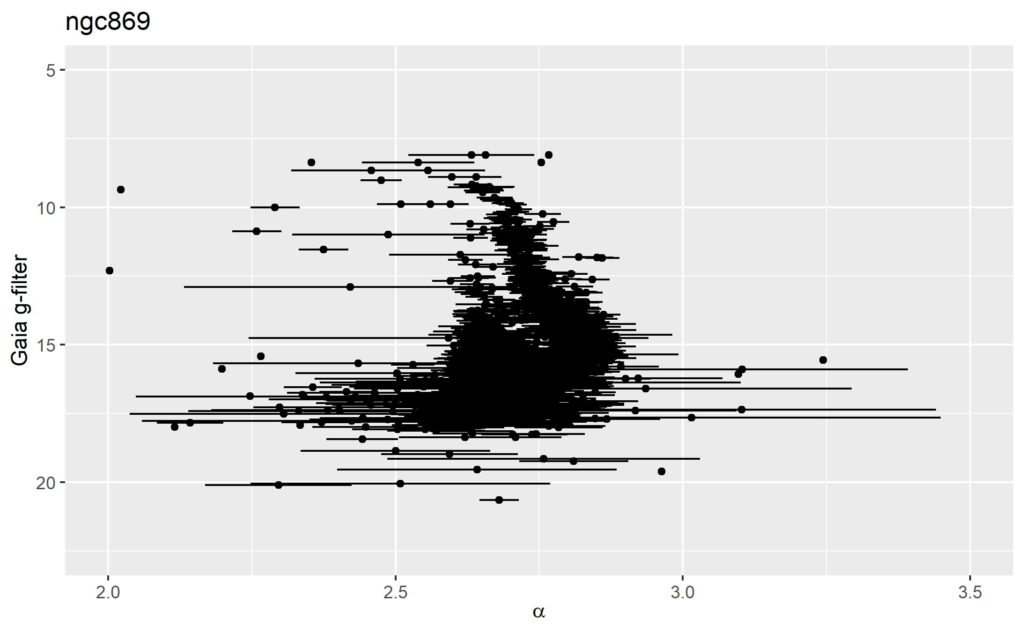
I identified star cluster members using astrometric data from ESA’s Gaia mission’s second data release (DR2). I used an algorithm known as DBSCAN, which checks the distances between stars in astrometric parameter space (in this case, parallax and proper motions in RA and Dec) and groups them accordingly. Because star clusters are gravitationally bound, members of a cluster will group together and have similar parallax and proper motion values, so by determining threshold values, we identified cluster members.
I found that after removing background stars and reducing the error bar size on our measurements, the second population of stars remains. This group of stars is as bright as the main sequence, but has a lower effective temperature and H-alpha equivalent width. Future work for this project will involve running more tests to try discover the identities of these stars.
Astrobite edited by: Emma Foxell