The Undergraduate Research series is where we feature the research that you’re doing. If you are an undergraduate that took part in an REU or similar astro research project and would like to share this on Astrobites, please check out our submission page for more details. We would also love to hear about your more general research experience!
Kayli Glidic
University of Arizona

This guest post was written by Kayli Glidic. Kayli is an undergraduate in her junior year at the University of Arizona, where she is studying astronomy and astrophysics. She conducted this research under the supervision of her advisor, Dr. Everett Schlawin, and presented it at AAS 237.
Despite the inability to spatially resolve exoplanets from their host stars, exoplanetary atmospheres contain a wealth of information that has subsequently placed priority on the spectroscopic analysis of atmospheres and the development of interpretive tools. Probing these environments has returned measurements on both the chemical composition and the thermal structure of these atmospheres that are capable of constraining planetary formation, evolution, and climate. Hot Jupiters present good test cases as they are large, hot, and relatively easily detectable. In particular, exoplanet CoRoT-1 b is especially interesting, as it is predicted to be a transitional planet between hot Jupiters (equilibrium temperatures around 1500K) and ultra-hot Jupiters (equilibrium temperatures over 2000K). Typical hot Jupiters atmospheres are expected to have temperatures that decrease with altitude (non-inverted temperature-pressure profiles) while ultra-hot Jupiters are thought to exhibit different atmospheric properties and may have inverted temperature-pressure profiles.
The spectroscopic data collected on CoRoT-1 b was reduced utilizing a spectroscopic data-reduction pipeline, called the Time Series Helper & Integration Reduction Tool (tshirt), which is a general-purpose tool for time series science. In time-resolved observations, especially for near-infrared detectors, the “ramp effect” is a dominant source of systematics, suggested to be caused by charge trapping, that limits photometric precision. It appears in time-series data as a hook-like feature at the beginning of the observation. Unique to this work was the focused use of the Ramp Effect Charge Trapping Eliminator (RECTE), a tool that takes into account the numbers of charge carrier traps, the trapping efficiency, and the trap lifetimes in every pixel on the detector enabling a better constraint and optimization of the secondary eclipse spectra to compare with representative models in this transitionary temperature regime.
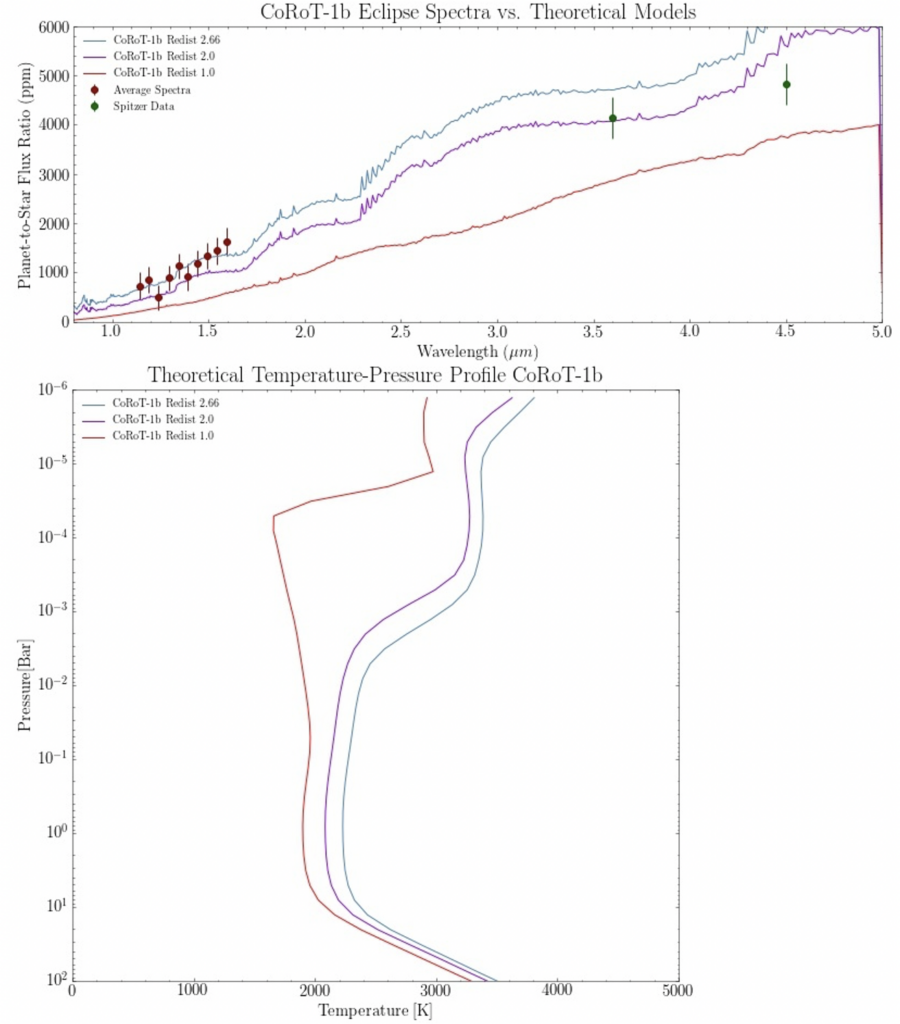
According to our findings, the average secondary eclipse spectra for CoRoT-1 b, as seen in Figure 1, appears to be generally featureless, similar to a blackbody-like emission. This average spectrum, according to CHIMERA models, corresponds best with no heat redistribution and an inverted temperature profile, as seen in Figure 1, indicating a possible upper high altitude layer that strongly absorbs stellar irradiance.
Astrobite edited by: Ali Crisp
Featured Image Credit: NASA/ESA/G. Bacon