The Undergraduate Research series is where we feature the research that you’re doing. If you are an undergraduate that took part in an REU or similar astro research project and would like to share this on Astrobites, please check out our submission page for more details. We would also love to hear about your more general research experience!

Nabeel Rehemtulla
University of Michigan
Nabeel Rehemtulla is an undergraduate student at the University of Michigan (UMich) graduating in April 2021. At UMich he studies Astrophysics and Computer Science (CS) and is passionate about areas of astronomy where he can best leverage CS techniques to perform novel research. This project is his honors thesis – advised by Dr. Monica Valluri – and was presented at the 237th meeting of the AAS in January 2021. His full iPoster is available here. You can contact him with any questions or comments at [email protected].
Spherical Jeans modeling is a technique for estimating the cumulative mass profile of a system from kinematics of tracers of its gravitational potential. It does so under the assumptions of spherical symmetry and dynamical equilibrium and has been applied to a wide variety of systems from star clusters to clusters of galaxies. I am specifically interested in Jeans modeling’s application to the Milky Way (MW), where I will infer our galaxy’s dark matter distribution from kinematics of field halo stars. In other words, Jeans modeling allows us to map our galaxy’s invisible matter from the positions and velocities of the galaxy’s visible matter. In the past, we have only had very limited observational data of tracers, so we have had to assume quantities to apply spherical Jeans modeling. With existing and upcoming observations of MW field halo stars from Gaia, DESI, the Rubin Observatory’s LSST and other spectroscopic surveys, we will obtain full 6-D phase space coordinates on orders of magnitude more tracers than before. In light of this upcoming dramatically expanded dataset, we revisit spherical Jeans modeling and test its ability to model simulated MW-like galaxies when the full 6-D phase space coordinates are widely available.
In preparation for the data, I have developed a novel Jeans modeling routine that fits B-Splines1 to the halo stars’ velocity and density profiles. B-Splines are a category of curve defined by fitting polynomial functions between successive grid points, called knots. We favor them because they are non-parametric, meaning they can represent a curve of any shape. In contrast, most implementations of Jeans modeling intended for the Milky Way take rigid, parametric forms for these profiles, which may poorly represent the true shapes of these distributions.
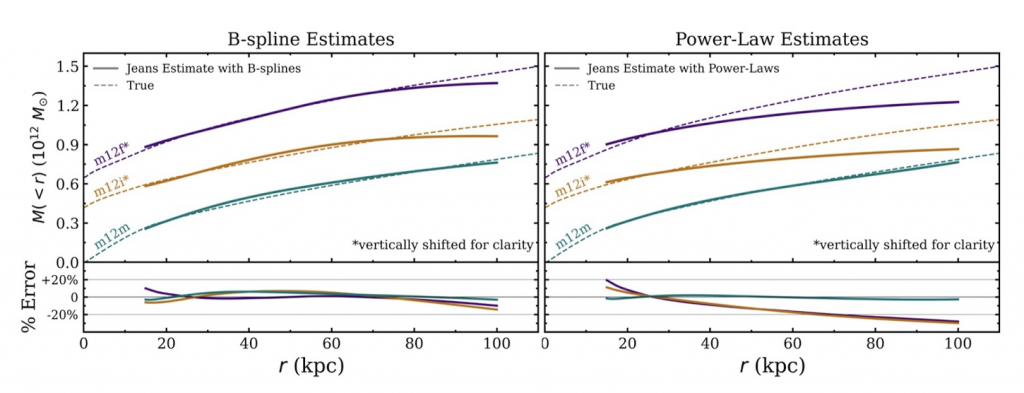
To validate the choice of B-Splines and the routine as a whole, I execute it on several progressively more realistic mock datasets that break the assumptions of sphericity and equilibrium in different ways. The results of these tests elucidate the performance of our routine on a diverse suite of input systems. Figure 1 compares my B-Spline routine’s performance with that of a more traditional power law-based routine when modeling realistic mock galaxies from the Latte simulations (Wetzel et al. 2016).
Along with the results shown in Figure 1, I run tests with upwards of a dozen other mock datasets. Together, the results demonstrate that the adaptability of B-Splines leads to consistently better estimations than parametric methods. I will apply our B-Spline-based routine with upcoming data on MW field halo stars to map the MW’s dark matter distribution.
1For more information on B-Splines, see section A.2.2 of Agama’s reference document.
Astrobite edited by: Huei Sears
Featured Image Credit: Modified image of M31 by Tony and Daphne Hallas