Authors: R.J. Bouwens, P.A. Oesch, M. Stefanon, et al.
First Author’s Institution: Leiden Observatory, Leiden University, NL-2300 RA Leiden, Netherlands
Status: Submitted to ApJ
For decades, astronomers have used methods of “extragalactic census” to anchor our theoretical understanding of galaxy evolution. The idea is to simply measure the number of galaxies within a volume of the universe as a function of some physical variable (like dark matter halo mass, stellar mass, or luminosity, for instance). When measured at one epoch or point in time, these censuses tell us a great deal about the universe by simply recording how common galaxies of different types are. If this measurement is carried out at various redshifts, one obtains a timeline of the universe that encodes the changes in the underlying galaxy population according to the variable in question.
Consider the ultraviolet (UV) luminosities of galaxies. The number of galaxies in a given volume as a function of UV luminosity has the catchy name of the UV luminosity function. The UV luminosity function (UV LF) is a particularly useful probe in galaxy evolution studies, since the UV luminosity of a galaxy is strongly correlated with its star formation rate (newly formed stars are bright in the UV). This means that if we can measure the evolution of the UV LF across the history of the universe, we can investigate the growth of stars within galaxies across cosmic time. Since this extragalactic census is purely observational, it is completely agnostic about the underlying physics of star formation. However, these types of measurements are nonetheless invaluable for theorists. Census-like observations such as the UV LF provide bedrock constraints for theories of galaxy evolution, because at the end of the day, any working model of galaxy evolution must be capable of reproducing them. The goal then is to obtain the most precise censuses possible.
In today’s astrobite, we explore a recent effort to obtain the premier measurements of the evolution of the UV luminosity function using observations from the Hubble Space Telescope.
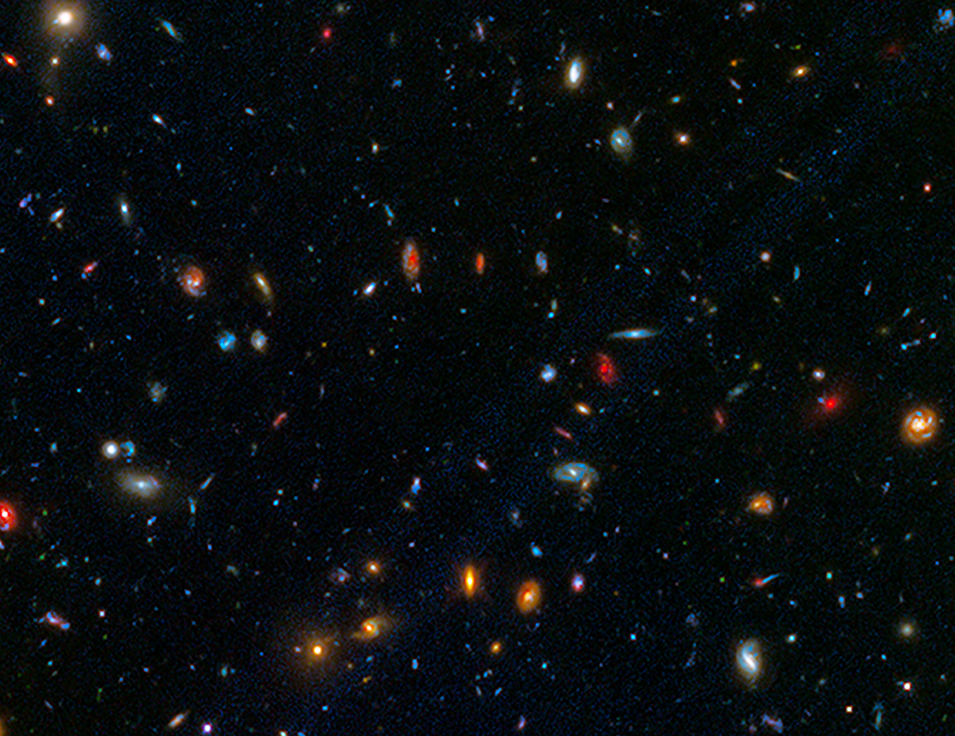
Figure 1: A piece of the Hubble Space Telescope observations taken as part of the Hubble Frontier Fields survey program and used in this work. This image shows hundreds of galaxies of a variety of shapes and sizes, reaching from today towards billions of years in the past. Image credit: NASA, ESA, J. Lotz, M. Mountain, A. Koekemoer, and the HFF science team.
Tackling the UV Luminosity Function with Hubble
This work combines nearly all of the deepest survey observations conducted with the Hubble Space Telescope (HST) to obtain the largest selection of galaxies at z > 2 to date from this facility. Their primary sample contains some 24,000 galaxies, making it more than twice as large as previous selections of galaxies from HST surveys. To measure the evolution of the UV luminosity function, galaxies are first grouped into redshift slices of width 1 in redshift space, from z ~ 2 to z ~ 9 (for example, galaxies within 1.5 < z < 2.5 are grouped together at z ~ 2). To achieve this, the team first uses the well-tested “drop-out” method (see this astrobite for another detailed explanation). A strong spectral feature in star-forming galaxies is the Lyman break at 912 Angstroms, where flux at shorter wavelengths is absorbed by gas in the intergalactic medium. At a given redshift, it is possible to fairly accurately exclude low-z galaxies by selecting only sources with significant flux at wavelengths longer than the Lyman break (their flux “drops out” at shorter wavelengths). For an even cleaner sample, the team also models the spectral energy distributions of the galaxies in their sample, comparing their observed photometry to model galaxy templates. This yields a distribution of possible redshifts for each source and an associated probability, which is used to exclude the color-selected galaxies that may in fact be low-z interlopers.
With the approximate redshift of each galaxy known, it is possible to infer its absolute magnitude and finally measure the UV luminosity function. Before measuring the UV luminosity function, they add to their dataset the constraints from several other efforts, including ground-based observations and a recently selected sample of galaxies at z ~ 10 from another work. The final UV luminosity functions at each redshift slice is shown below in Figure 1, tracking its evolution from z ~ 10, when the universe was 0.48 billion years old, to z ~ 2, when the universe was 3.3 billion years old.
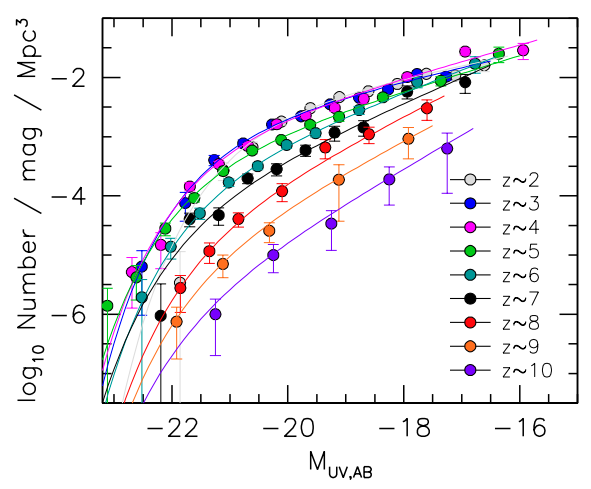
Figure 2: The UV luminosity function (UV LF) measured in this paper at each redshift between 2 < z < 9, and including the UV LF at z ~ 10 from another work (Oesch et al. 2018). Across this ~ 3 billion year time period, the number density of all galaxies increases by orders of magnitude with fainter galaxies becoming less dominant over time. Fig.5 in the original work.
Extracting Extragalactic Information
As can be seen from Figure 2, interpreting the changes in the UV luminosity function between 2 < z < 10 is complicated. To simplify the matter, the authors model the UV LF at each redshift with a parameterization known as a “Schechter function.” This model combines a power-law at the faint end and an exponential decline on the bright end. It has three free parameters: alpha, the slope of the faint-end power-law; M*, the absolute magnitude where the slope changes from power-law behavior to exponential; and phi, the normalization. The Schechter function fits to the data are also shown in Figure 2.
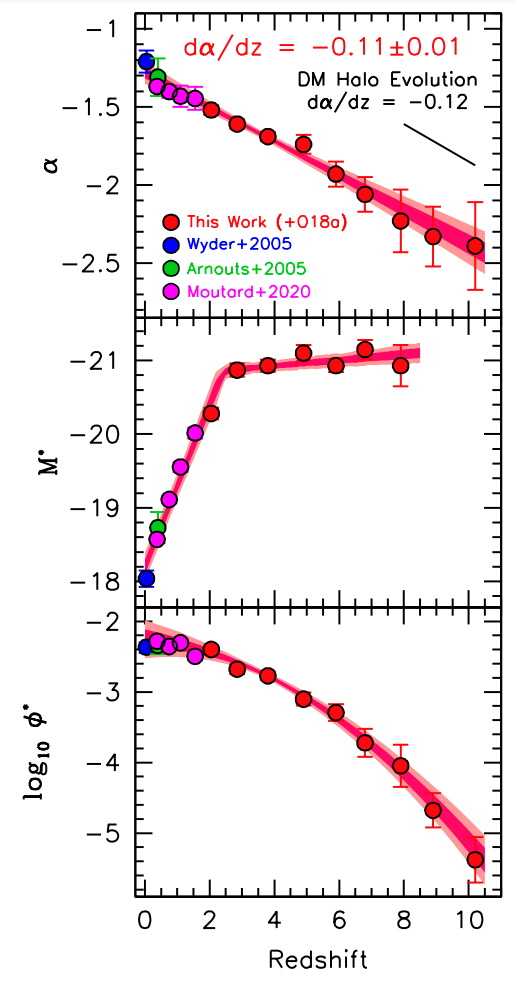
Figure 3: The evolution of the parameters of the Schechter function as measured in this work. The Schechter function is used to model the UV luminosity function, and it is defined as a combination of a power-law and faint magnitudes and an exponential decline and bright magnitudes. Alpha is the faint-end slope; M* is marks the transition between a power-law shape and exponential decline; and phi is the overall normalization. The remarkable result presented in this paper is demonstrated in the top panel: The evolution of alpha in the UV luminosity function almost matches perfectly with the evolution of the low-mass end of the dark matter halo mass function, supporting a fundamental link between dark matter halo mass and star formation in galaxies. Fig. 9 in the original work.
The evolution of each of the Schechter parameters in the UV LF tells us something physical about star formation in galaxies throughout cosmic time. The measured trends in these parameters are shown in Figure 3. As can be seen, the faint-end slope (alpha) follows a strongly linear relationship with z and becomes a weaker power-law over time, indicating that brighter galaxies become more common from early times to later times. The turnover magnitude (M*) stays roughly constant until a dramatic change at z ~ 2.5, where it is thought that the most massive and bright galaxies begin to quench and fade in the UV. Finally, the normalization (phi) smoothly increases across cosmic time and flattens out near z = 0, indicating a smooth growth in the overall number density of galaxies.
What is most interesting, the authors note, is that the faint-end slope evolution almost identically matches the evolution of the dark-matter (DM) halo mass function (the number of galaxies per unit volume as a function of DM halo mass). In fact, if one assumes a constant efficiency of turning gas into stars within a given DM halo, and applies this assumption to the dark-matter halo mass function, the trends shown in Figure 2 are almost exactly reproduced. This supports an intimate link between the DM halo mass of galaxies and their ability to form stars.
By combining all of the existing survey fields observed by HST, the authors obtained a precise characterization of the UV LF across a dramatic three billion years of our universe’s history, from 2 < z < 10. With the imminent launches of the Roman Space Telescope (and its enormous field of view, 100x that of HST) and the James Webb Space Telescope (with its extreme infrared sensitivity), we can be confident that our understanding of the universe will only grow from here.
Edited by Alex Pizzuto.