The Undergraduate Research series is where we feature the research that you’re doing. If you are an undergraduate that took part in an REU or similar astro research project and would like to share this on Astrobites, please check out our submission page for more details. We would also love to hear about your more general research experience!
Ava Stockman
Bellevue College
This guest post was written by Ava Stockman, a student at Bellevue College. Ava did this research with Dr. Joey Key in UW Bothell’s Gravitational Wave Astronomy group over the summer as part of an REU. She will be graduating in 2023 and in the future, she hopes to work on the hardware side of LISA.
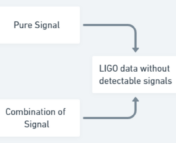
Gravitational waves are ripples in the fabric of spacetime generated by the acceleration of very large masses (for example, the merging of two black holes). The European Space Agency and NASA-funded Laser Interferometer Space Antenna (LISA) aims to detect new gravitational wave sources when it is launched in the 2030s, opening the door for new discoveries in gravitational wave astronomy. LISA can detect gravitational waves at a wide range of frequencies, and this presents data analysis challenges because many gravitational wave signals are significantly below the detector noise. The first LISA Data Challenge (LDC) simulates LISA data by injecting gravitational wave signals into an idealized instrument noise model. The goal of the challenge is to retrieve the gravitational wave information.
The LDC for Extreme Mass Ratio Inspirals (EMRIs) contains a single simulated EMRI signal injected into instrument noise. The orbit of an EMRI is highly eccentric and complex, and lasts for years before the merger, making for a complicated waveform. EMRI gravitational wave signals are multiple orders of magnitude lower than the detector noise and many other gravitational wave sources detected by LISA, making advances in data analysis strategies imperative for successful EMRI detection. By using the Mock LDC master code the noisy and noiseless EMRI data were successfully manipulated and plotted, we calculated the signal to noise ratio and were able to recover the signal. We are currently working on a method to compare simulated EMRI signals with a range of parameters to the LDC EMRI injection. This project, as well as future LISA Data Challenges, will allow us to advance our techniques for filtering noisy data, allowing the EMRI signal to be extracted from the raw signal originally detected by LISA.
Astrobite edited by: Haley Wahl
Featured image credit: Ava Stockman


