The Undergraduate Research series is where we feature the research that you’re doing. If you are an undergraduate that took part in an REU or similar astro research project and would like to share this on Astrobites, please check out our submission page for more details. We would also love to hear about your more general research experience!
Omar French
University of Maryland, Baltimore County
This guest post was written by Omar French, a fourth-year student studying Physics at the University of Maryland, Baltimore County (UMBC). He completed this research under Dr. Eileen Meyer, an assistant professor of physics at UMBC. He has presented these results at the 237th meeting of the American Astronomical Society.
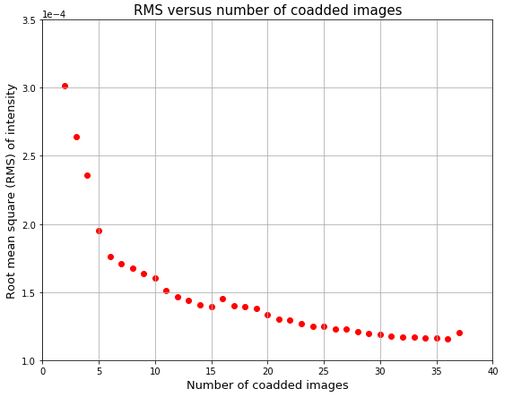
A great debate in astrophysics is the nature of the high-energy (optical/X-ray) emission mechanisms that generate the enormous jets of plasma that emanate from the nuclei of active galaxies. One of the major obstacles to improving our understanding of jets is the lack of high-quality radio images, which are crucial for tracing the jet structure and estimating the magnetic field. A common technique to create these higher-sensitivity radio images is to stack many images together (theoretically, the thermal noise of images is expected to scale with t-1/2, where t is scanning time). In this project, radio images are obtained from archival Very Large Array (VLA) data.
Image stacking is laborious to do manually and therefore is desirable to automate. That being said, until shown otherwise, automating certain processes tends to produce less accurate images than doing so “by-hand” without a script. To test this, I have written a script that fully automates the entire process of image stacking. Notably, we have found that image noise scales roughly in accordance with t-1/2, meaning automating this process is viable and certainly worth doing for large sample sizes (see image below). With the script, one can spend five minutes of their time stacking hundreds of images, making this process of unveiling faint plasma effortless.
Astrobite edited by: Haley Wahl
Featured image credit: Omar French