
This post was written by Christine Ye. Christine is a senior at Eastlake High School and part of the Gravitational Wave Astronomy group at the University of Washington Bothell. Her research interests include compact objects (especially pulsars!), gravitational waves, and cosmology. In her free time, she studies classical ballet and music, and loves helping people learn about space!
Title: The coherent motion of Cen A dwarf satellite galaxies remains a challenge for ΛCDM cosmology
Authors: Oliver Müller, Marcel S. Pawlowski, Federico Lelli, Katja Fahrion, Marina Rejkuba, Michael Hilker, Jamie Kanehisa, Noam Libeskind, Helmut Jerjen
First Author’s Institution: Observatoire Astronomique de Strasbourg, Universite de Strasbourg – CNRS, UMR 7550 Strasbourg, France
Status: Published in Astronomy & Astrophysics Letters [open access]
The Earth may not be flat, but many of our favorite things are. The planets of the solar system lie in roughly the same plane. The Milky Way is home to a flattened disk of dust, gas, and stars. Even the Universe is expected to be flat. But finding a flat arrangement of small dwarf “satellite” galaxies around larger galaxies is actually a problem for the standard model of cosmology, which is known as Lambda Cold Dark Matter (LambdaCDM).
Galaxies and planetary systems are roughly flat because they are assembled by tons of collisions of dust and gas clumps. But the dynamics of collisions don’t seem to govern satellite galaxies. Simulations predict satellite swarms should be pretty spherical and randomly rotating. So seeing flattened and co-rotating (appearing to rotate in the same direction) swarms of satellites around galaxies in the Local Group is so perplexing, cosmologists gave it its own name: the Planes of Satellites Problem.
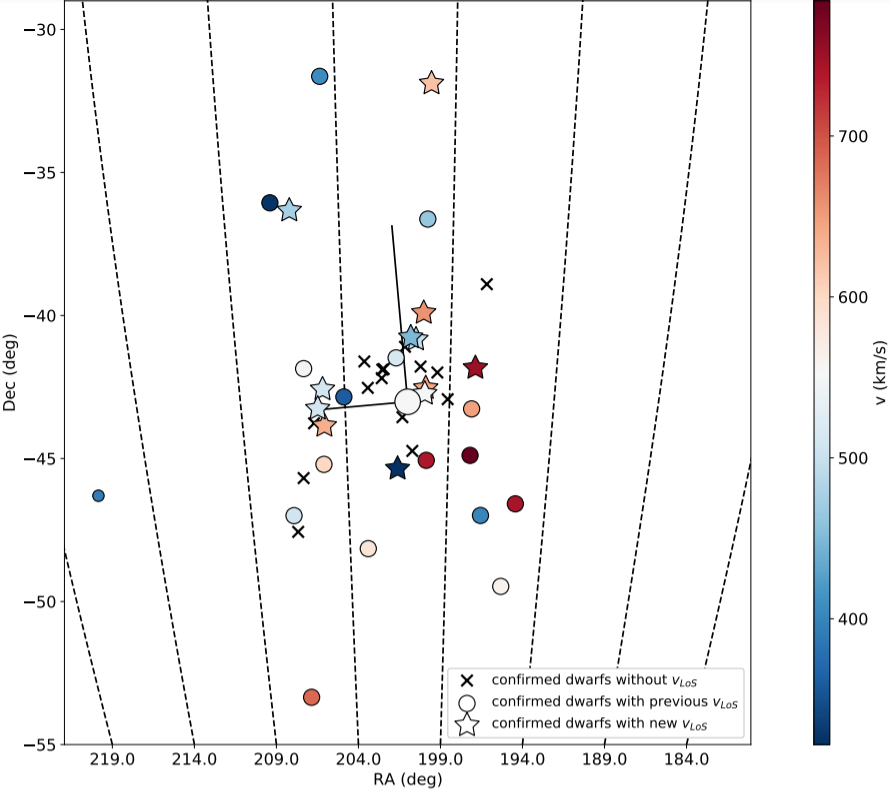
In 2018, a group of cosmologists (Müller et al. 2018a) observed 16 satellite galaxies around a nearby radio galaxy, Centaurus A (Cen A), and found yet another plane of satellites. Two years later, the same team obtained spectra for 12 more of Cen A’s satellites for a total of 28, and checked to see if the evidence for the plane remains. The verdict? The satellites still appear flattened (see Figure 1), with a minor-to-major axis ratio b/a of 0.52. For reference, something perfectly round would have b/a = 1, and something perfectly flat would have b/a = 0. Also, 21 of 28 satellites show what is called kinematic coherence: just as a disk would rotate, satellites with opposite velocities are on opposite sides of the swarm. If satellite galaxies and their velocities are randomly distributed, such coherence has just a 1.26% probability!
This level of flattening of satellite swarms is really unexpected. To quantify just how unexpected, the researchers used IllustrisTNG, a massive computing project simulating cosmological galaxy formation, particle by particle. The largest galaxies in the simulation have their own satellites just like Cen A does, so the simulated galaxies can serve as a basis for comparison.
From the Illustris TNG100 simulation, the researchers selected the 28 largest satellites around Cen A-like galaxies, measuring the minor-to-major axis ratio b/a and the number of kinematically coherent satellites.
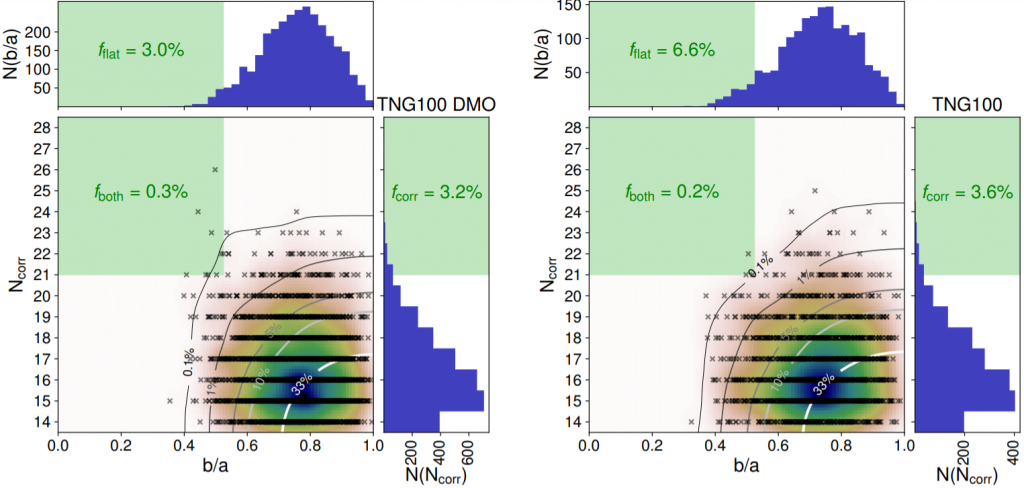
We can think of each simulated analog as a random sampling from many possible satellite arrangements, with Cen A’s satellite swarm being just one possibility. If this is true, Cen A would be an extreme outlier (see Figure 2)! Without baryons (Standard Model or “normal” particles) only around 3% of simulated systems can match or exceed either the flattening or the correlation, and just 0.3% can match or exceed both. With both baryons and dark matter, just 7% of systems are at least as flattened, 4% of systems are at least as correlated, and just 0.2% match or exceed both.
Some scientists argue that this just means the Local Group is an outlier. Others suggest it could be a deficiency in simulations, a by-product of recent galaxy mergers, or caused by excess galaxy accretion along the local filaments of the cosmic web (see this Astrobite for more). As seen in Figure 1, around Cen A alone there are 13 known satellites that don’t have velocity measurements yet and over 30 waiting to be confirmed. No matter what more data on Cen A will show, there’s much to be excited for!
Astrobite edited by Tarini Konchady
Featured image credit: TNG Collaboration