Title: Tracing the Top-of-the-atmosphere and Vertical Cloud Structure of a fast-rotating late T-dwarf
Authors: Elena Manjavacas, Theodora Karalidi, Xianyu Tan, Johanna M. Vos, Ben W. P. Lew, Beth A. Biller, Natalia Oliveros-Gomez
First Author’s Institutions: AURA for the European Space Agency, MD, USA; Johns Hopkins University, MD, USA
Status: Accepted to Astrophysical Journal
While they have a reputation as “failed stars”, brown dwarfs might have more in common with their gas giant planet cousins. With swirling, patchy clouds in their atmospheres, the light curves of brown dwarfs have been seen to vary in amplitude as they rotate and bring different faces with variable cloud coverage into view. By observing brown dwarfs over their rotation periods with spectrophotometry, astronomers can simultaneously measure how much the atmosphere is changing in multiple wavelength bands. This technique means a 3D map of a brown dwarf’s atmosphere can be built, since different wavelengths probe different levels of pressure within an atmosphere. Although most spectrophotometric observations of brown dwarfs have used the Hubble Space Telescope, the authors of today’s paper employed the ground-based Keck I telescope to study 2M0050–3322, a rapidly rotating T-type brown dwarf.
Seeing One Atmosphere Through Another
Since the levels of variability in brown dwarf atmospheres can be small, it is important to characterise any other non brown dwarf sources of noise in the data. For these ground-based observations, particular care has to be taken given that the Earth’s atmosphere will also be changing over the course of the observations. Using the MOSFIRE multi-object spectrograph, the authors observed 2M0050–3322 for two of its rotation periods (around 2.5 hours in total). They also observed several other nearby stars to help calibrate the impacts of things like the local humidity and temperature on the measurements. The light curves of all the objects were obtained at multiple different infra-red wavelengths, including in the J and H bands and in a region slightly redder than the H band which the authors denote as the CH4-H2O band. By dividing each 2M0050–3322’s light curves by the median light curve of the calibration stars, 2M0050–3322’s light curves could be corrected for any impacts of the Earth’s atmosphere to find the true variability of the brown dwarf, as shown in Figure 1.
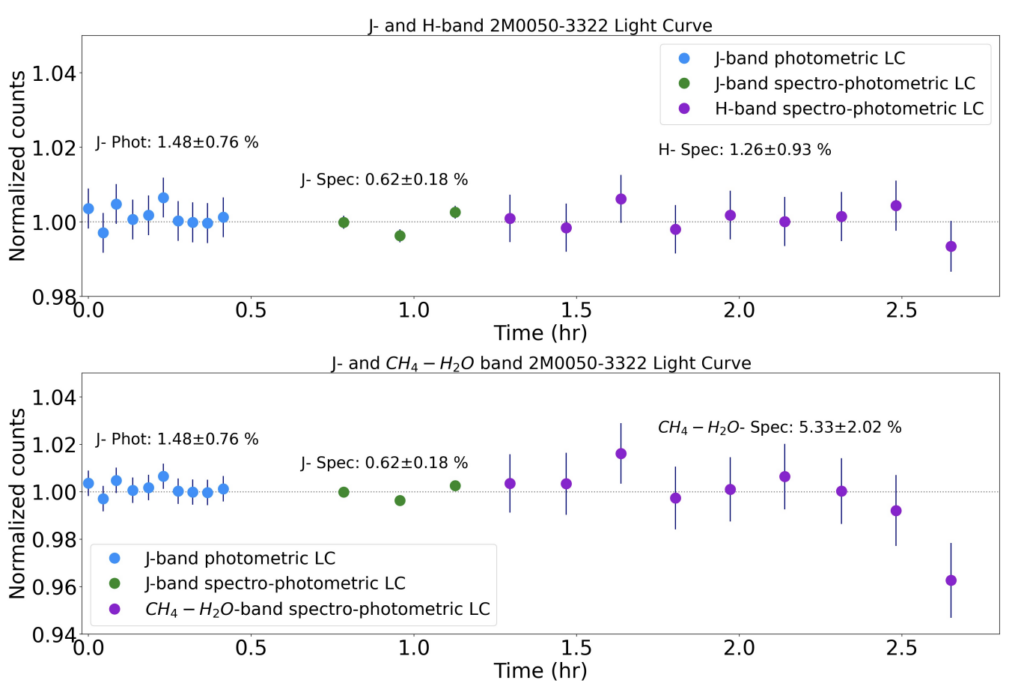
Over the course of their observations, the authors found that 2M0050–3322 had a minimum to maximum fluctuations of ~1% in the J and H band, and a higher 5% amplitude in the redder CH4-H2O band. This seemingly low level of variation was also confirmed by fitting flat and sinusoidal models to the light curves, with a flat line proving to best the preferred fit for all the observations.
Models to the Rescue?
With observations to hand, the authors then sought to compare their results to models of 2M0050–3322, to see if a similar lack of variation was present. General Circulation Models (GCMs) of the thermal flux of the atmosphere predict a slightly sinusoidal light curve with almost a 1% variation, matching the amplitude seen in the J and H band observations! Meanwhile, models of the structure of clouds in the atmosphere show that 2M0050–3322 has various types of clouds at different pressures, meaning that each of the observation bands could be probing different clouds.
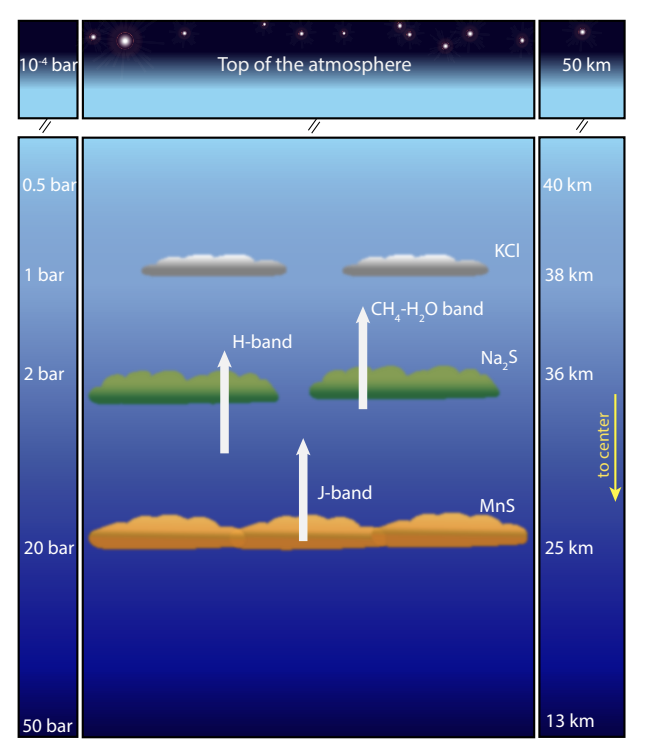
Figure 2 shows that the CH4-H2O band traces similar pressure levels as those where sodium sulphide (Na2S) and potassium chloride (KCl) clouds condense. This could explain why the CH4-H2O light curves show more variability than the other bands, which reach deeper into the atmosphere and therefore do not probe these clouds. While these modelling efforts begin to explain the observations of the brown dwarf, the authors caution that longer-term monitoring is likely needed to fully explain the mysteries of 2M0050–3322.
Astrobite edited by William Balmer
Featured image credit: NASA/JPL-Caltech