Title: Photometric Characterization and Trajectory Accuracy of Starlink Satellites: Implications for Ground-Based Astronomical Surveys
Authors: Grace Halferty, Vishnu Reddy, Tanner Campbell, Adam Battle, Roberto Furfaro
First Author’s Institution: Department of Aerospace and Mechanical Engineering, University of Arizona, Tucson, AZ, USA
Status: Published in Monthly Notices of the Royal Astronomical Society (open access)
As reported in a host of recent astrobites, the night sky is getting more crowded, with privately owned satellite megaconstellations such as Starlink now representing at least 45% of all functioning satellites. Their impact on observational astronomy has been well documented, with the low orbits of these satellites causing them to appear as bright streaks across images from the largest sky surveys down to the smallest backyard telescopes. At particular risk is the Vera C. Rubin Observatory and its Legacy Survey of Space and Time (LSST). Starting in 2024, LSST will scan the entire night sky every few days to map objects in the Solar System and Milky Way, and detect transient events like Supernovae – tasks that will be made harder with the presence of satellites in its images.
While steps such as painting satellites with an anti-reflective coating or adding visors to block their glare have attempted to reduce their brightness, the satellites remain some of the brightest objects in the sky. Furthermore, although it is possible to mitigate these effects by closing camera shutters as a satellite passes overhead, precisely coordinating this without wasting valuable observing time can be extremely challenging. Low Earth orbit (LEO) objects like Starlink satellites move quickly across the sky, and while their positions are tracked, uncertainties on publicly available data of satellite positions are often limited. To try and better understand the impacts of LEO satellite constellations on ground based astronomy, the authors of today’s paper observed and characterised a selection of Starlink satellites, with the hope of determining whether programs like LSST may be able to plan around them.
Like A Diamond in the Sky
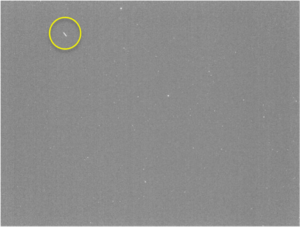
Over the course of 16 months, the authors used a wide field of view sensor coupled with a 135 mm lens, collectively known as the Stingray Prototype, to collect multiple short exposure images of 61 unique Starlink satellites. By using short exposures like Figure 1, the satellites could be imaged without producing significant trails as they moved, allowing for a better characterisation of their positions and brightnesses.
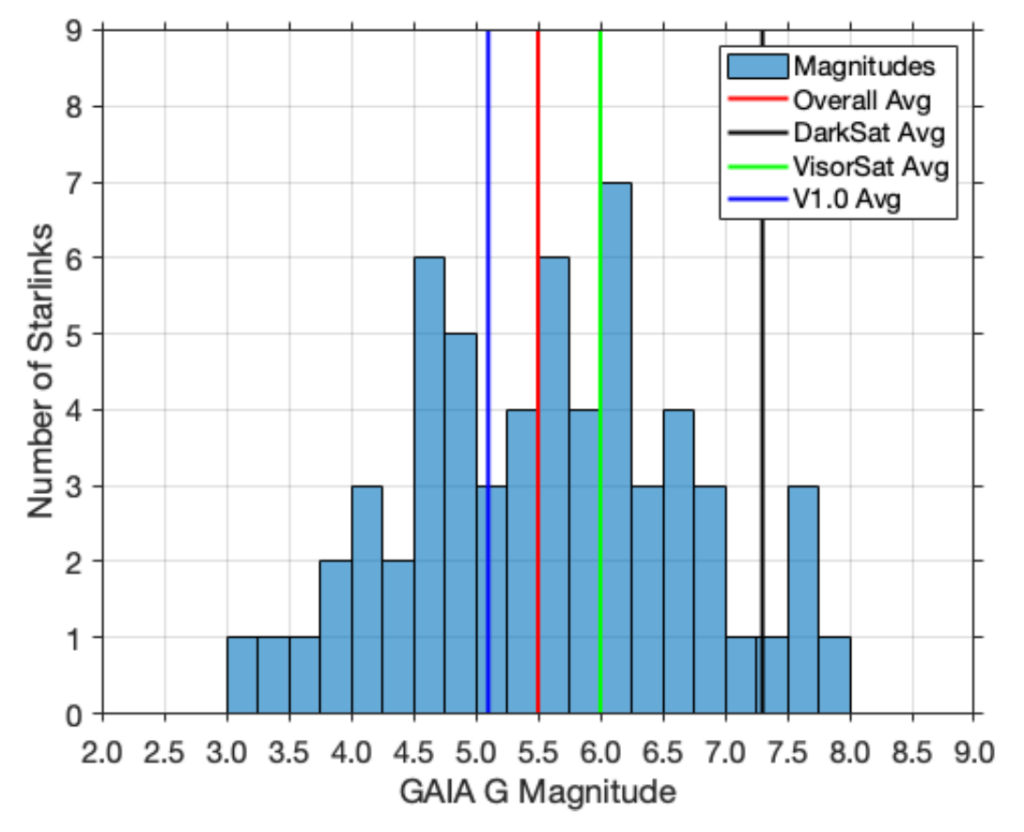
After the images were reduced, elliptical apertures were placed over the satellite traces to extract their brightness and calibrated against solar-type stars within each of the images. Since the satellites were imaged using a Sloan g’ filter, these brightnesses could be transformed to Gaia G magnitudes. As shown in Figure 2, the three different types of Starlink satellites (V1.0 the original design, DarkSat with the anti-reflective coating, and VisorSat with visors) had a collective average apparent magnitude of 5.5, roughly as bright as Uranus seen with the naked eye. Although the DarkSats were 7.6 times fainter than the original V1.0 design, this design has been discontinued. While VisorSats were still 2.3 times fainter than the V1.0 satellites, their average magnitude of 6 means that they are still bright enough to have a significant impact on observational astronomy
Up Above the World So High
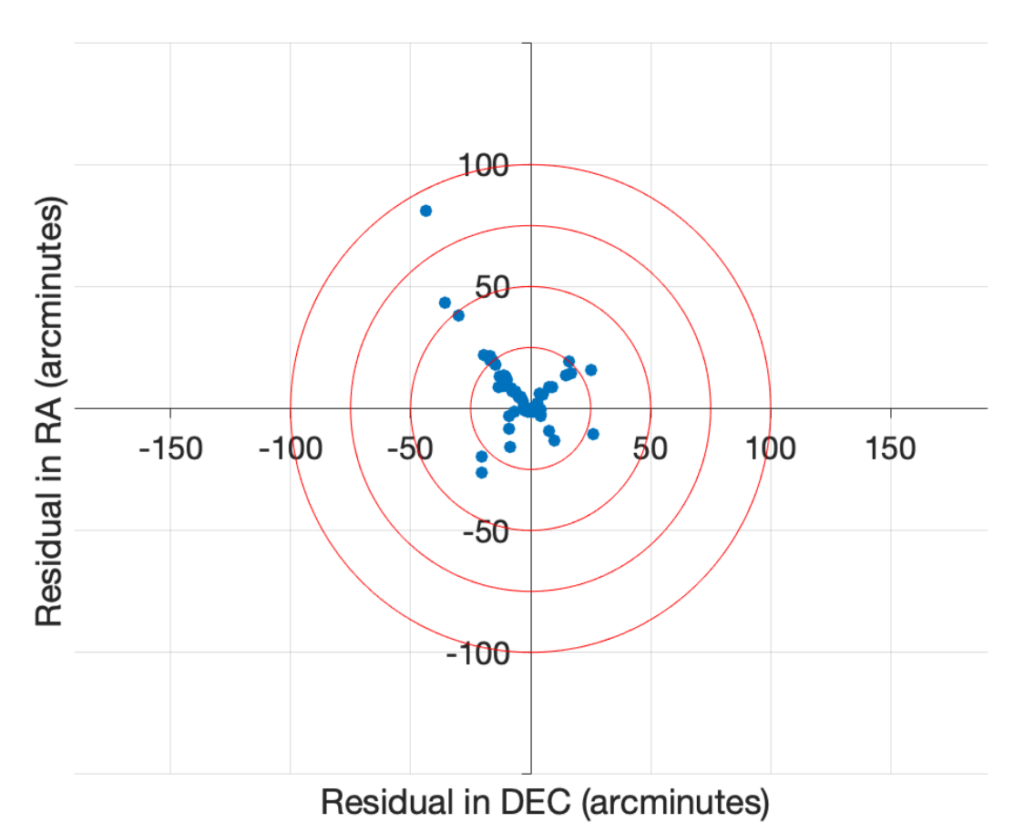
Using the predicted and the observed positions of the satellites, the authors were also able to assess the accuracy of publicly available orbital positions. Of particular interest were any trends with the age of the satellites, since it can take several months after launch for them to reach their lifetime orbits and may continue to settle after this time. With no significant correlations found between the time since launch and the position uncertainties, the satellites were typically observed where and when they were predicted to be. The average difference between the predicted location of the satellites and their observed paths was around 0.1 of a degree, as shown in Figure 3, with the timing of the crossings on average accurate to 0.3 seconds.
Since initial strategies for closing the shutters at the Vera C. Rubin Observatory recommend pausing observations for 10 seconds as a Starlink passes through the field of view, the small position and timing uncertainties make this plan seem plausible. However, the authors caution that there were 31 times during their observations wherein a Starlink was expected to be observed, but either did not appear or another object passed through the field of view instead. These unobservables could have much larger uncertainties, appearing significantly earlier or later than predicted. Furthermore, as the authors only observed satellites that had reached their final orbit, it is possible that there are more significant positional and timing uncertainties in newer satellites.
While there is certainly more to be characterised, the development of satellite megaconstellations shows no signs of slowing down, and will likely continue to plague observational astronomy for a long time to come.
Astrobite edited by Sarah Bodansky
Featured image credit: Victoria Girgis / Lowell Observatory