Title: Pegasus W: An Ultra-Faint Dwarf Galaxy Outside the Halo of M31 Not Quenched by Reionization
Authors: Kristen B. McQuinn, Yao-Yuan Mao, Matthew R. Buckley, and 3 others
First author’s institution: Department of Physics & Astronomy, Rutgers, The State University of New Jersey, NJ, USA
Status: available as an arXiv preprint
Our local patch of the Universe is populated by a number of galaxies – the so-called “Local Group”, consisting of our very own Milky Way, the similar-in-mass Andromeda Galaxy (M31), and between 50 to 100 known “dwarf”, or low-mass galaxies. The faintest, least massive of these, termed ultra-faint dwarfs (UFDs), range in mass from a few thousand solar masses down to just a few hundred solar masses! UFDs in the Local Group are of immense interest to astronomers, since they can be used to study a variety of phenomena ranging from dark matter dynamics to stellar feedback, and chemical evolution to ram pressure stripping. Owing to the low mass and weak gravitational potentials of UFDs, these various physical processes often have outsize effects on their stars and gas, making them ideal objects for study.
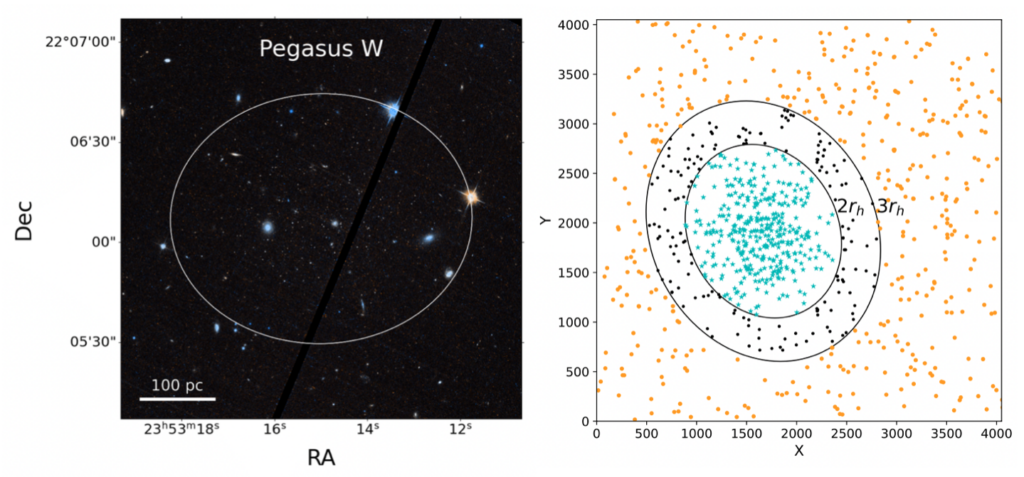
Today’s authors report the discovery of a new UFD named Pegasus W and analyse some of its interesting properties. Most UFDs are extremely difficult to detect as they are faint and often diffuse – in fact, looking at a simple image of one may not even reveal its presence, as Figure 1 shows! Therefore, they are often detected by looking for statistical overdensities of stars in large sky surveys, and that’s exactly how Pegasus W was discovered from DESI data. The authors of today’s papers then followed up with Hubble Space Telescope (HST) imaging to study the stellar populations in the galaxy.
Pegasus W is ~ 915 kiloparsecs from the Milky Way and closer to Andromeda, but still outside the virial radius (a measure of how far a galaxy’s gravitational influence extends) of Andromeda. Therefore it is not considered a satellite of Andromeda but rather an isolated UFD. It is also quite faint, with a V-band absolute magnitude of about -7.2, and an estimated stellar mass of only 6.5 x 10^4 solar masses!
One of the most important properties of a galaxy is its star formation history (SFH) – a fossil record of how it assembled and grew over time. Local Group dwarf galaxies are especially well suited for SFH studies, because of how nearby they are. The Local Group is the only place in the entire Universe where we can get resolved photometry (imaging) of the individual stars in a galaxy, whereas for all other galaxies further away we can only observe their starlight as an unresolved blob! This is key for measuring accurate SFHs, as resolved stellar imaging allows us to build a colour-magnitude diagram (CMD) for a galaxy – a plot of all its stars comparing their luminosities to their temperatures. After constructing a galaxy’s CMD, we can fit stellar evolution models to it to figure out how old its various stellar populations are, and this allows us to reverse-engineer the entire record of how it formed its stars over cosmic time!
Figure 2 shows how this analysis was carried out for Pegasus W. The top left panel shows the observed CMD for the galaxy, with the top right being the best-fit CMD from stellar evolution modelling. The bottom left shows the residuals; i.e., what results from subtracting the model from the data. The residual significance diagram on the bottom right shows a checkerboard pattern, which indicates that the model is a good fit.
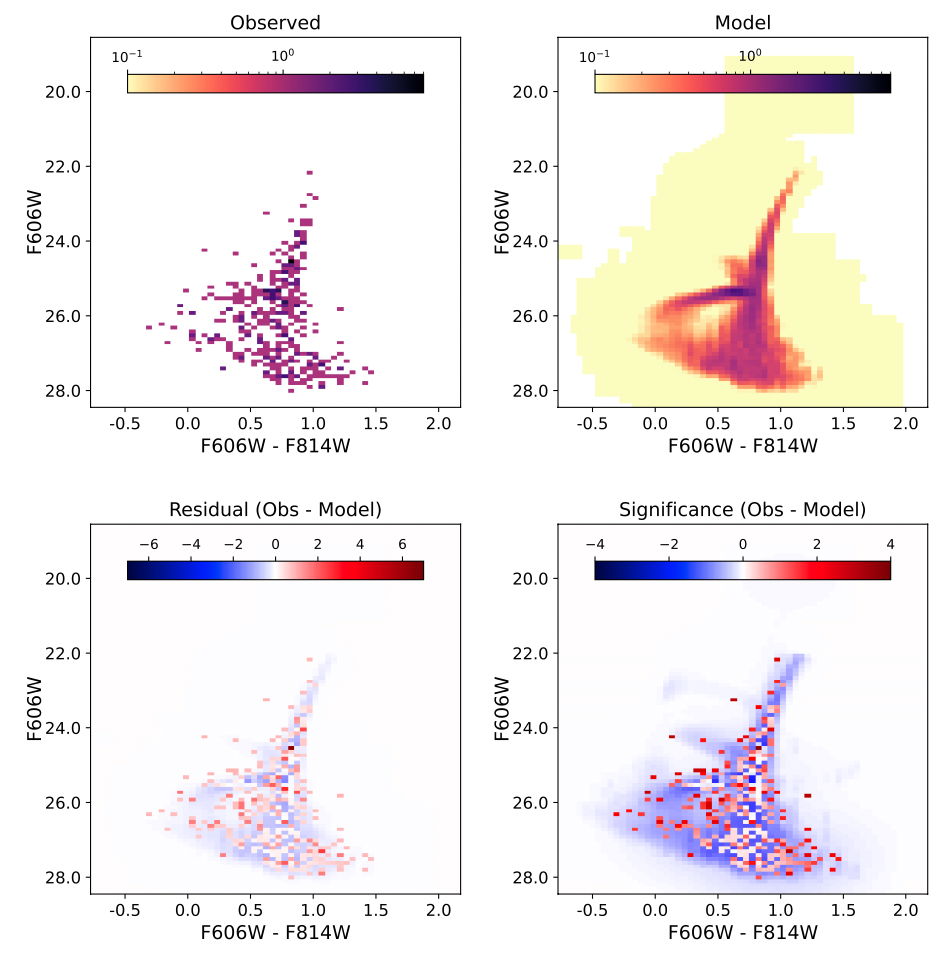
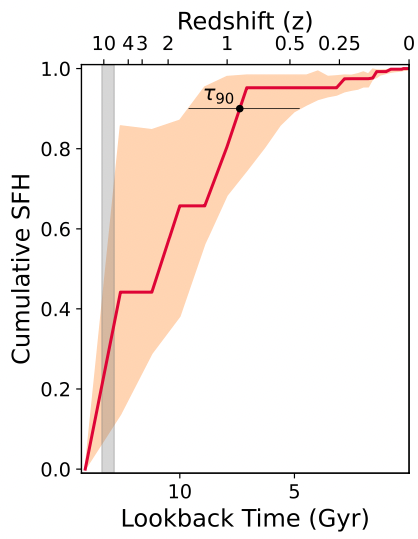
Figure 3 shows the star formation history (SFH) that the authors inferred for Pegasus W. The y-axis shows the fraction of its final stellar mass, and the x-axis shows lookback time from present day (right hand side being present day and the left hand edge representing the Big Bang). The red curve shows the growth of Pegasus W’s stellar mass over time, with the orange shaded region representing the uncertainty on the SFH.
The authors note what is most unique about Pegasus W – most ultra-faint dwarfs known to date have very short SFHs at very early times; that is, most ultra-faint dwarfs formed all their stars at early cosmic times and were quenched (ceased forming stars) over 10 billion years ago. Astronomers believe that this early quenching was likely due to cosmic reionisation, when the hydrogen gas in the Universe went from neutral to ionised due to radiation from the first stars and galaxies. However, as Figure 3 shows, Pegasus W does not appear to have quenched during reionisation (indicated by the vertical grey shaded region), and continued forming stars well after!
The puzzle of Pegasus W’s star formation history is likely to generate significant debate amongst astronomers studying galaxy evolution and reionisation. The authors note that better photometric data and perhaps even spectroscopy would help improve the uncertainty on the star formation history measurements, and that JWST is likely to help shed more light on this mystery in coming years.
Astrobite edited by Isabella Trierweiler
Featured image credit: Wikimedia Commons
The stellar mass of UFDs may be as low as you indicate, “but the extrapolated virial masses of UFDs are ∼ 109 M☉ (e.g., Strigari et al. 2008)” [with dark matter].
You’re right! The total virial mass (including dark matter, stars, gas, and dust) of ultra-faints can be anywhere from 10^8 – 10^10 solar masses. However, this is still much lower than the virial mass of more massive galaxies — UFDs have, in general, the lowest virial masses amongst known galaxies. The value for the Milky Way, for example, is roughly 10^12 solar masses. Therefore, the moniker “ultra-faint” or “extremely-low-mass” applies to UFDs even if one considers total virial mass.