Title: The role of mergers in driving morphological transformation over cosmic time
Authors: G. Martin, S. Kaviraj, et al.
First Author’s Institution: Centre for Astrophysics Research, University of Hertfordshire, Hatfield, UK
Status: Published in Monthly Notices of the Royal Astronomical Society [open access]
by Thinh Nguyen

Thinh Nguyen is a first year astronomy graduate student at the University of Illinois, Urbana-Champaign. His research involves using cosmological simulations to galaxy formation and evolution. In his spare time, Thinh enjoys photography, hiking, and spending time with his friends at cozy cafés.
The universe is not a static place. Gravity plays the role of an alchemist, attracting and merging different galaxies to change their morphology (well, this alchemist is not very interested in gold, but let’s be honest, galaxies are much cooler than gold). Understanding this process helps us explain our present morphological landscape, where the universe contains a lot of massive spheroidal galaxies. Today’s paper looks into how the merging process affects galaxies of different masses and morphologies, and how the galaxies transform into the appearances that we are seeing today.
To study the whole merging process, the authors use the Horizon-AGN cosmological hydrodynamic simulation. This simulation includes various important radiative processes such as gas cooling and heating, AGN feedback (more in this bite!), stellar feedback (more detailed definition in this bite!), etc. to produce good agreements with our observations of galaxies. The authors determine the galaxy morphology in the simulation using the V/σ ratio, which is the ratio between the mean rotational velocity and the mean velocity dispersion (a nice animation showing the concept of velocity dispersion can be found here). Spheroidal galaxies usually contain random stellar motion, and thus they have low rotational velocity and high velocity dispersion, which results in a low V/σ ratio. On the other hand, disk galaxies have a larger V/σ ratio because they have a larger rotational velocity component and thus lower velocity dispersion. To differentiate the two populations, the authors employ the threshold of 0.55 for V/σ.
The authors quantify the morphological change of a galaxy by computing the parameter Δmorph. Δmorph is equal to the difference between the galaxy’s V/σ ratio 1 Gyr after and 1 Gyr before the coalescence, divided by the V/σ ratio 1 Gyr before the coalescence. The authors choose the time stamp 1 Gyr before and 1 Gyr after the merging because this paper only focuses on mergers whose mass ratio is larger than 1:10, and these mergers usually finish within 2 Gyr. This choice will ensure that the merging product is finalized for us to measure its V/σ. A positive Δmorph means that the merging makes a galaxy more disky or spins up the galaxy. In contrast, a negative Δmorph means that the merging makes a galaxy more spheroidal or spins down the galaxy.
Different ingredients result in different products
Figure 1 (Figure 2 in the original paper) shows how spheroidal and disc galaxies at different masses transform via mergers over time. The authors define major mergers (solid line) as mergers whose mass ratio between the colliding galaxies is greater than or equal to 1:4, and minor mergers (dashed line) as mergers whose mass ratio is between 1:10 and 1:4. The different colors indicate different mass bins of the main progenitor. As more massive galaxies only formed later in the universe, the simulation does not have mergers at the higher redshift for galaxies whose stellar mass is larger than 1011 M☉ (the figure’s last two rows).
As indicated by the negative Δmorph on the right column, the authors found that mergers generally make disk galaxies more spheroidal regardless of the merger’s mass ratio, main progenitor’s mass, or redshift. We can also see that major mergers have a larger effect in changing Δmorph than minor mergers. Furthermore, as time evolves (meaning that you need to read the figures from right to left), disk galaxies develop larger bulges and more random stellar motion from their previous mergers, and future mergers become less effective in transforming the already-transformed morphology (imagine if you had already worn your jackets for 10 years, 1 more year won’t wear it out as much as the first year). This is why you see Δmorph gradually decrease when the redshift gets smaller. On the other hand, if the main progenitor is a spheroid, the outcome of the merging is much more random. The collision can either make the galaxy more disky or more spheroidal, as indicated by the large dispersion around the median Δmorph line. If we focus only on the median value, on average, mergers are more likely to spin down higher-mass galaxies (bottom two plots) and spin up lower-mass galaxies (top two plots), especially at higher redshifts.
And then spheroids show up everywhere!
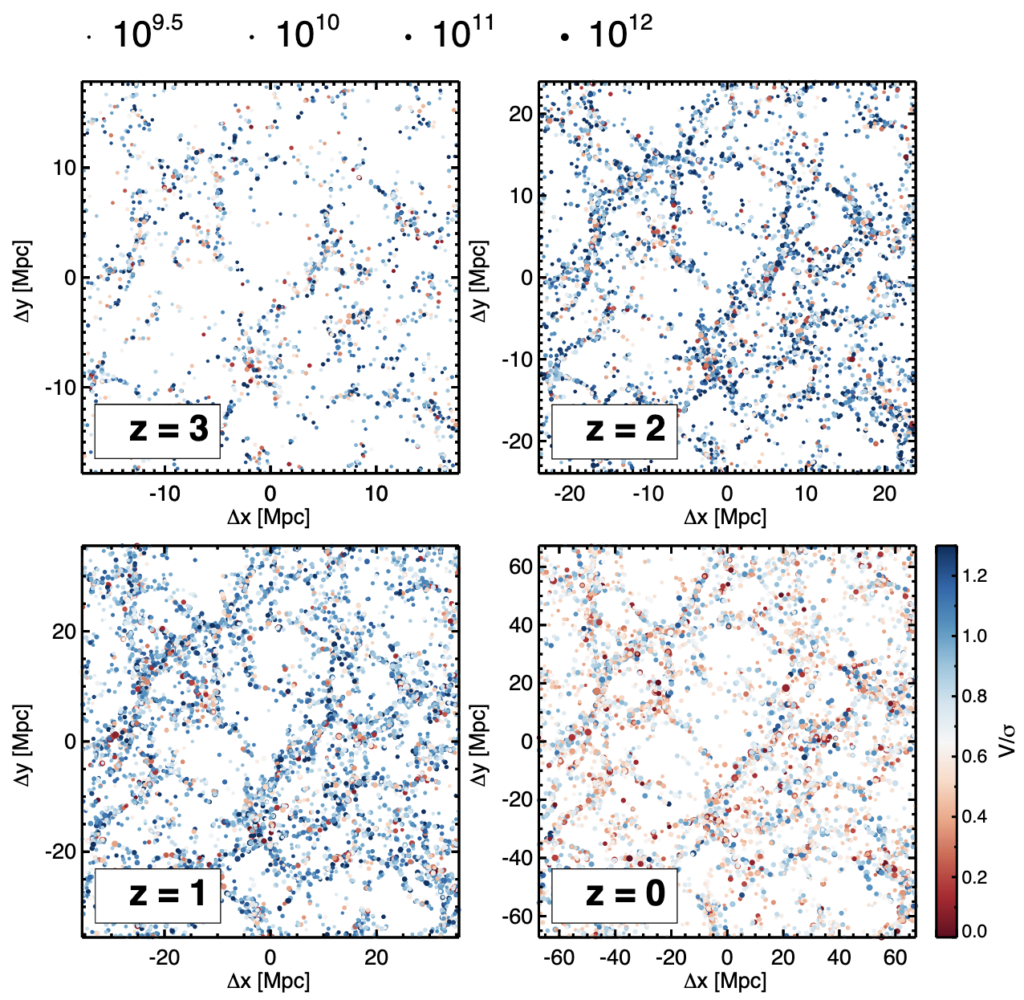
A more visual representation of how galaxy morphology evolves is displayed in Figure 2 (Figure 9 in the original paper). Four projection plots show the distribution of galaxies whose mass is larger than 109.5 M☉ and their morphology at four different time steps. The point size represents the mass, blue points indicate disky galaxies, and red points indicate spheroidal galaxies. At the redshift of 3 (which means more than 11 billion years ago), the universe was mostly filled with disc galaxies. As time goes by, merging occurs and transform the morphological landscape, turning discs into spheroids, as you already see in Figure 1. As a result, our current time (z = 0) witnessed a much larger number of spheroidal galaxies than there were in the past (the z = 0 plot has a lot more red points compared to the higher-redshift plots).
Because we can only observe snapshots of galaxies, simulation is a wonderful tool that allows us to see and study the whole process of galaxy evolution. The universe is a chaotic place, and galaxies usually do not evolve by themselves. Rather, they constantly receive “nudges” from their neighbors to grow and transform into the shapes that we see today.
Astrobite edited by: Ali Crisp
Featured image credits: ESA/NASA/NOIRLab/J. Dalcanton (left), figure 2 from the paper (right), with annotations from the author.