Title: Understanding the radio emission from epsilon Eridani
Authors: Luis F. Rodríguez, Susana Lizano, Jorge Cantó, Ricardo F. González
First Author’s Institution: Instituto de Radioastronomía y Astrofísica, Universidad Nacional Autónoma de México, A.P. 3-72 (Xangari) 58089 Morelia, Michoacán, México
Status: Submitted to Astronomy and Astrophysics [open access]
One of the closest sun-like stars– a star that is burning hydrogen in its core and that has a surface temperature between 5000-6000K– is the young and active star named epsilon Eridani (eps Eri). eps Eri’s proximity, activity, and similarity to the Sun has made it a popular object to observe across the electromagnetic spectrum. Different parts of the spectrum unveil many different phenomena and features at play; X-ray emissions have revealed eps Eri has magnetic cycles, sub-millimeter observations have found a debris disk, millimeter observations have shown flares, optical spectro-polarimetry suggests a magnetic field ~2000 times stronger than the Sun’s, and radio emissions find a stellar wind that may be as much as a 1000 times stronger than the Sun’s. Looking at eps Eri frequently exposes new details about the star; the authors of this paper looked at eps Eri in the radio again and found unpolarized, bursty emission.
This Work
To study eps Eri, the authors observed it with the Karl Jansky Very Large Array (VLA) – a collection of 25 m dishes that can be separated by as much 36 km. It has equipment to observe at frequencies as low as 74 MHz (or wavelengths of 4 meters) and as high as 45 GHz (about 7 millimeters). The authors observed eps Eri at 10 GHz for six observations between February and April 2020 and at 33 GHz for two observations in May 2020. The particular configuration of the array at the time of observing gave them a maximum spatial resolution of ~0.6 arcseconds– this is like standing on the New Jersey coast and being able to resolve the Hollywood sign in Los Angeles, or being able to resolve a bacterium from a meter away! With just these eight observations, the authors found a variety of variability from eps Eri.
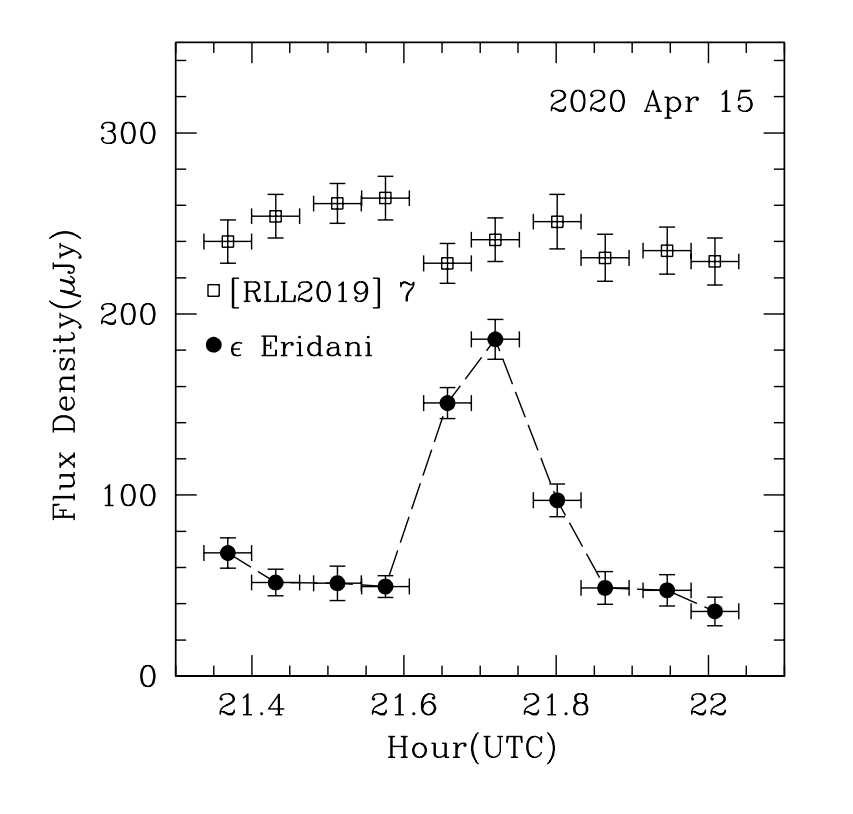
As it turns out, eps Eri was detected in only one of the two 33 GHz observations, which were separated by a period of ten days– this suggests variability on the timescales of days, at least at 33 GHz. On the other hand, eps Eri was detected in all six observations at 10 GHz. The focus of this paper is on a factor of 2 increase in the flux density between two of these observations that were separated by just 3.6 hours which, on closer inspection, was due to a 20-minute long burst, shown in figure 1.
The major question is: what emission mechanism and physical process is responsible for this signal? There are a few factors they can consider to help them distinguish between different processes: 1.) the emission’s polarization (whether the light is oriented predominantly in a circular or linear fashion), 2.) its brightness temperature (what temperature would the object have to be assuming the emission is thermal in order to produce the signal), and 3.) and its spectral index (how much does the flux density change as a function of the frequency you observe it at).
To start: eps Eri’s emission showed no significant polarization. This means that incoherent emission– emission where the light is emitted randomly and thus does not emit all in one direction– is possibly responsible for the burst’s signal. Secondly, the authors find that the brightness temperature may need to be as much as 108 K to account for the signal’s flux density. Such a temperature is extremely uncommon for a stellar atmosphere in thermal equilibrium; they therefore conclude the emission is likely nonthermal. Finally, and unfortunately, the signal was not strong enough for the authors to determine the spectral index.
Where did the emission come from?
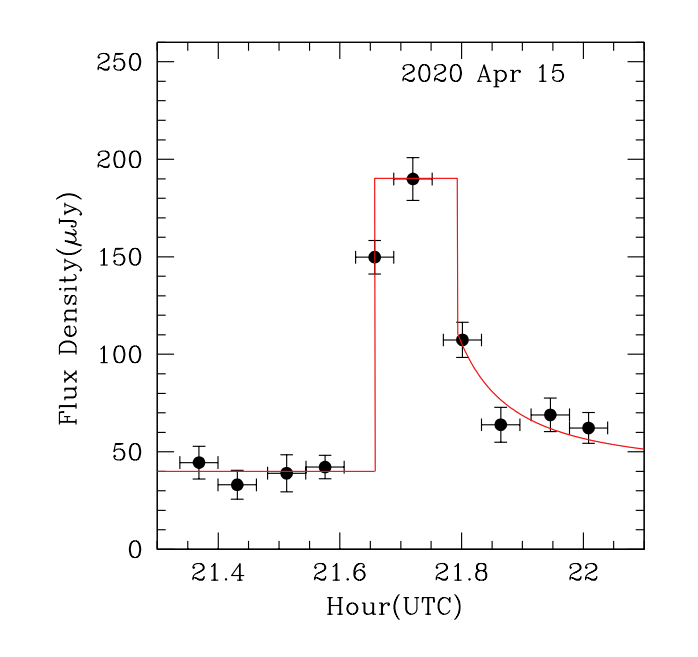
Even without the spectral index, knowing that the emission is likely nonthermal and not highly polarized helps restrict the possible emission mechanisms to two main contenders– emission from magnetic-field accelerated electrons moving at mildly-relativistic (gyrosynchrotron) or highly-relativistic (synchrotron) speeds. Although it is difficult to distinguish between the two mechanisms without the spectral index information, the authors suggest a possible physical mechanism for producing the emission– shocks. Like on the Sun, shocks may be driven by flares heating gas in eps Eri’s stellar wind. The authors attempt to model the emission from such a shock, and find it agrees fairly well with the light curve of eps Eri’s burst as shown in figure 2, supporting the conclusion that the emission is likely nonthermal in origin.
Although the authors could not definitively determine the emission mechanism responsible for eps Eri’s burst, their work emphasizes the importance of continued observations of eps Eri so that we might eventually understand all the interesting phenomena at play. The authors note the importance of the use of improved telescopes– like the next-generation VLA– in characterizing the emission from eps Eri, as well as other sun-like stars.
Astrobite edited by Megan Masterson
Featured image modified from NASA/Lynette Cook