Title: DESI Complete Calibration of the Color-Redshift Relation (DC3R2): Results from early DESI data
Authors: J. McCullough, D. Gruen, A. Amon, A. Roodman, D. Masters, A. Raichoor, D. Schlegel, R. Canning, F. J. Castander, J. DeRose, R. Miquel, J. Myles, J. A. Newman, A. Slosar, J. Speagle, M. J. Wilson, J. Aguilar, S. Ahlen, S. Bailey, D. Brooks, T. Claybaugh, S. Cole, K. Dawson, A. de la Macorra, P. Doel, J. E. Forero-Romero, S. Gontcho A Gontcho, J. Guy, R. Kehoe, A. Kremin, M. Landriau, L. Le Guillou, M. Levi, M. Manera, P. Martini, A. Meisner, J. Moustakas, J. Nie, W. J. Percival, C. Poppett, F. Prada, M. Rezaie, G. Rossi, E. Sanchez, H. Seo, G. Tarlé, B. A. Weaver, Z. Zhou, H. Zou
First Author’s Institutions: Stanford University, Ludwig-Maximilians Universität München
Status: Submitted to MNRAS [closed access]
You’re probably familiar with the idea that when astronomers use telescopes like Hubble, JWST, and ALMA to study faraway objects, we’re actually looking back in time! The light we see has taken millions or billions of years to travel from the object we’re looking at to our telescopes, so we see the object not as it would look today if we were right next to it, but as it would have been millions or billions of years ago.
But as that light travels through an expanding Universe, it itself is expanded, its wavelength stretching out in a phenomenon called “redshifting” because longer wavelengths of visible light appear redder to our eyes. If we can measure the redshift of a given galaxy, we can know exactly how far back in time we’re looking, which has big implications for the study of galaxy formation and evolution. New data on the Universe’s oldest galaxies is constantly becoming available, and it’s extremely important that we know the redshifts of those galaxies as precisely and accurately as possible, to avoid drawing incorrect conclusions.
Normally, redshift is best measured using spectroscopic techniques. A measurement is taken of the object’s electromagnetic spectrum, then compared to the spectrum we’d expect to see if that object was nearby. By looking at the difference between the position of a given spectral line in the measured versus expected spectra, we can estimate the object’s redshift.
This is great… when we actually have spectra. Unfortunately, we can’t always rely on being able to take spectroscopic data, and often have to determine redshift through photometric means instead, comparing the observed colors of our galaxies to what we think their original colors would have been. Because galaxies vary widely in color, however, this is much more difficult than the spectroscopic method, and relies heavily on our existing understanding of the color-redshift relation, the way in which redshifting affects the color of a sample of many different types of galaxies.
That’s where today’s authors come in. They describe a new dataset from the Dark Energy Spectroscopic Instrument (DESI), designed to calibrate this relationship in an unprecedentedly detailed and complete manner. The DESI Complete Calibration of the Color-Redshift Relation (DC3R2) survey compares the photometric properties of over 230,000 galaxies with spectroscopically confirmed redshifts, in order to probe the relationship between a galaxy’s distance from us and its observed color and brightness.
More data, fewer problems
To do this, the authors combine spectroscopic data from DESI with photometric data across nine color bands from the KiDS-VIKING survey, with near-continuous wavelength coverage from around 450 to around 2200 nm–covering the full visible range, and part of the infrared. This allows them to better tell the difference between reddening caused by processes within the galaxy and true redshift, but also returns a highly complex dataset with many dimensions. To combat the high dimensionality, they organize the data using a neural network-like algorithm called a Self-Organizing Map (SOM), which allows them to compress the data into two dimensions without losing any clustering that might have existed in the many-dimensional original. Ideally, we would have at least one galaxy in every SOM cell, with multiple galaxies per cell for as many cells as possible.
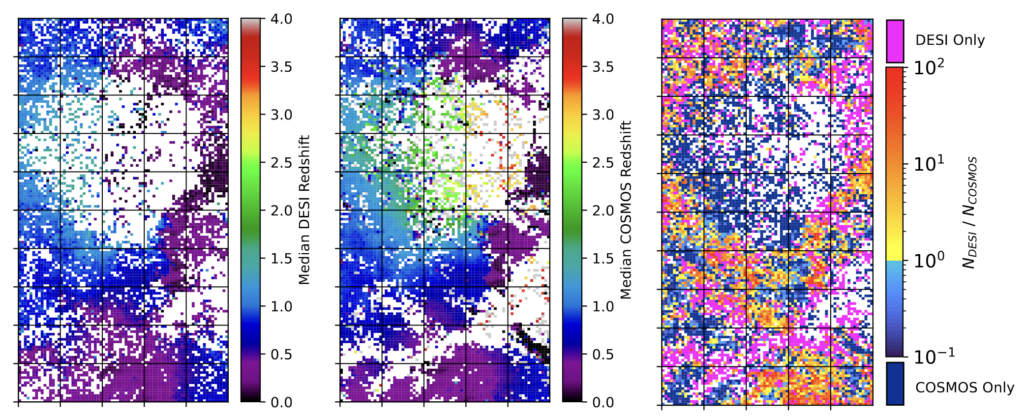
Once they have their SOM populated, the authors can then use it to calibrate the color-redshift relation as well as to study the properties of the galaxy population as a whole. With hundreds of thousands of galaxies representing over half of the population that will be visible to Euclid and the Vera Rubin Observatory, DC3R2 was able to make a significant difference in the amount of data available to us, thereby giving much higher confidence in our photometric redshift determination than prior datasets gave. Figure 1 compares the DC3R2 redshifts (left) to redshifts determined by Hubble’s Cosmological Evolution Survey (COSMOS, center), showing that due to DC3R2’s higher data volume (right) there is a significant difference between the older COSMOS redshifts and the new DESI data.
They also test the impact of systematic effects on photometric redshift, including selection biases and a possible dependence of magnitude on redshift. Although the data is consistent with a lack of intrinsic magnitude-redshift dependence, the constraint is relatively weak. We still have to be very conscious of any effects we introduce by selecting galaxies with a brightness cutoff, because galaxies that appear bright are likely to be close by, regardless of their color.
Although the study described here represents a step forward in our ability to characterize and calibrate redshift from photometric data, we still don’t have a perfect understanding of this complex relationship. Future surveys will have to be extremely careful to avoid and mitigate systematic bias and error in their datasets, especially if they cover fewer color bands or have poor-quality photometry. We’re still not done calibrating the color-redshift relation, though! As we continue to add photometric data at more wavelengths, fainter galaxies, and more areas of the sky, as well as spectroscopic data at higher qualities and redshifts, our models can only get better.
Astrobite edited by: Aldo Panfichi
Featured image credit: ESO/UltraVISTA
This is an excellent summary! Thanks so much for putting this together 🙂