Title: CloudFlex: A Flexible Parametric Model for the Small-Scale Structure of the Circumgalactic Medium
Authors: Cameron B. Hummels, Kate H. R. Rubin, Evan E. Schneider, Drummond B. Fielding
First Authors’ Institutions: TAPIR, California Institute of Technology, Pasadena, CA, USA; Department of Astronomy, San Diego State University, San Diego, CA USA; Center for Astrophysics and Space Sciences, University of California, San Diego, La Jolla, CA, USA
Status: Submitted to AAS Journals [open access on arXiv]
If you or I spent a long time sitting in a bathtub, we’d probably shrivel up and quickly become indistinguishable from a raisin. Galaxies, on the other hand, spend their lives bathed in a reservoir of gas known as the circumgalactic medium, or CGM. In fact, the presence of the CGM is necessary for the long term growth and survival of the galaxy. More precisely, the CGM provides the gas that regulates a galaxy’s ability to form stars—for example, as star formation depletes gas from the interstellar medium, inflows from the CGM replenish that supply.
Our understanding of this diffuse gas reservoir has largely been driven by observing its effect on background light (i.e., along so-called quasar sightlines) through absorption features. These measurements have indicated the presence of gas in both hot (T~106 K) and cool (T<104K) phases. However, the presence of such a stark temperature difference between the various components of this intergalactic gas would produce fluid instabilities that could quickly drive the cold component to fragment into a collection of small ‘cloudlets’. Self-consistently modeling these structures in large numerical simulations is challenging because they require significant dynamic range—one must be able to resolve clouds on smaller than parsec scales while also modeling the large scale motions of gas on galactic (~kiloparsec) scales.
Inspired by this, today’s authors set out to construct a simple model to efficiently describe the distribution and properties of these cool gas cloudlets embedded in broader cloud complexes (larger clouds composed of many cloudlets) within the CGM. Leveraging such a model to predict observed line shapes will allow us to begin to constrain the detailed substructure of this galactic bathtub.
Constructing the model
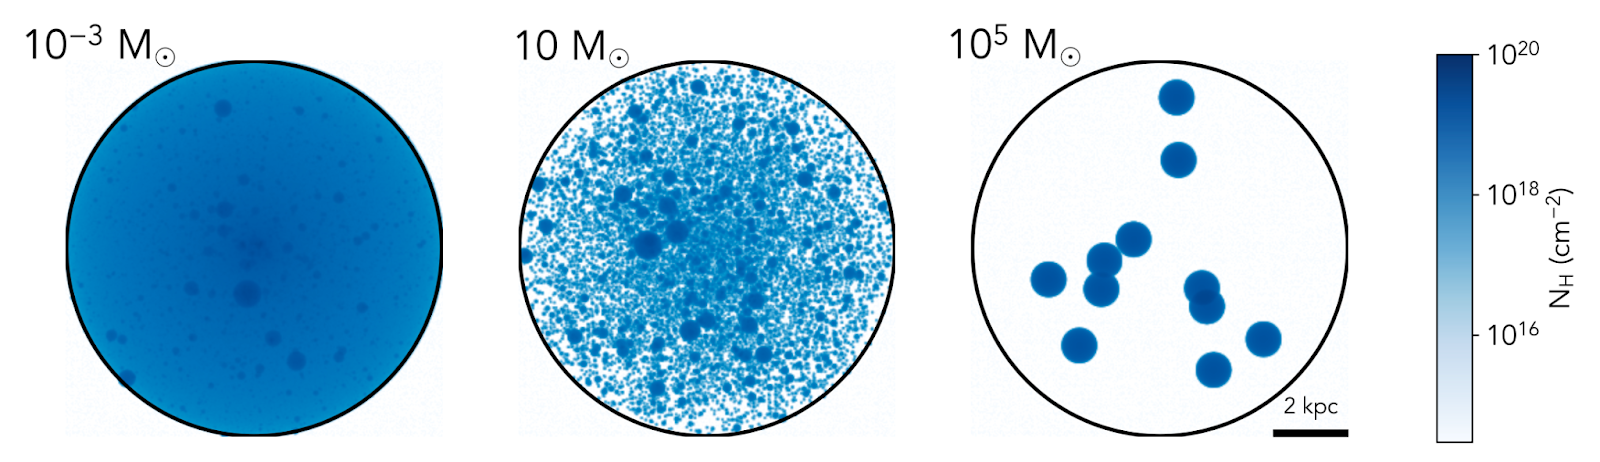
To construct their CGM model, today’s authors populate these so-called cloud ‘complexes’ with a collection of randomly sampled cloudlets and observe the resulting configuration. In detail, they statistically sample cloudlet properties based on a series of predetermined distributions. For example, the total mass of their cloud is set to be a million times the mass of our Sun. Then, based on their chosen parameters for the minimum mass of an individual cloudlet and the shape of their mass probability distribution (i.e., the function that tells you how likely it is for a cloudlet with a given mass to exist), they randomly generate cloudlets until the total mass of these objects equals the pre-set total mass. They combine this with probability distributions for the distance of the cloudlets from the center of the complex and the turbulent velocity of the cloudlets to produce a mock cloud complex structure, such as the three examples shown in Figure 1.
Observing the CGM
In this manner the structure of the cloud complexes is determined by a choice of 11 parameters that can be flexibly varied to explore the effects of cloud structure on the resulting observations. The key observational probe that has been historically used to study the CGM is the shapes of absorption features in the spectra of distant, luminous quasars. Because the shape of these features is a direct result of the interaction of background light with the CGM gas and the CGM is thought to be a highly disordered, turbulent medium, observed features will in principle be sensitive to where in the medium the light passes and how dense the absorbing objects are. For example, light passing through the center of the cloud in the left panel of Figure 1 will likely interact with more cloudlets than light passing near the edge and thus the observed spectra should reflect this.
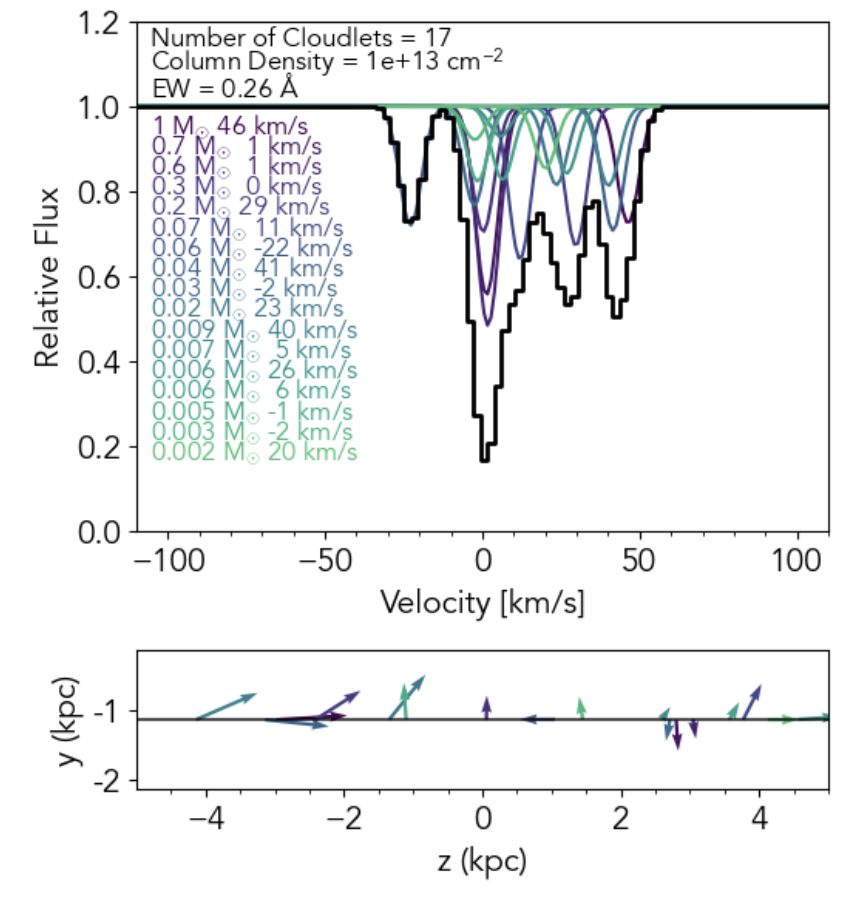
In Figure 2, today’s authors demonstrate how they can use this model to predict an observed line profile (read: shape)—in this case for a Magnesium-II line. This chosen line intersects 17 cloudlets as it passes through the complex (i.e., travels along the z direction in the lower panel). Each of these cloudlets has a different velocity that will cause it to contribute to a slightly different absorption feature in the spectrum because of the Doppler effect (the motion of the cloudlet causes the wavelength of the light it receives to stretch or shrink so that a given absorption line—which should have a fixed wavelength location—appears at a longer or shorter wavelength in the rest frame of the quasar), yielding the left-right offsets of the dips in the upper panel of Figure 2. Each cloudlet’s contribution to the absorption is then modeled by a so-called Voigt profile, which describes how the width of a spectral line will be determined by its internal temperature and density. The cumulative contribution of these profiles then produces the observed spectral feature.
Turning the knobs
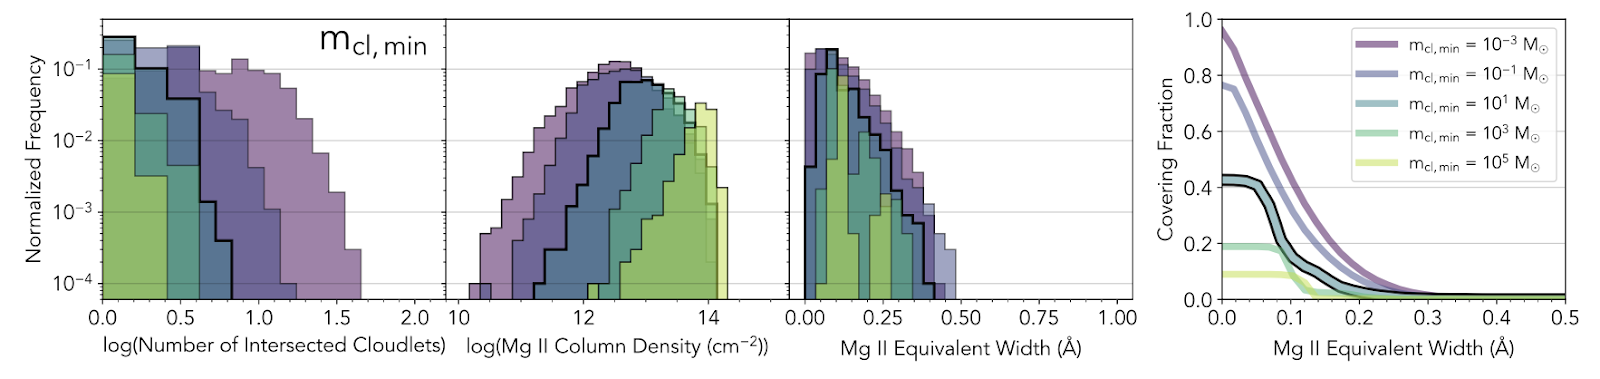
To understand the utility of such a framework, the authors then demonstrate how observed profiles respond to variations in the chosen parameters, such as minimum cloudlet mass. To this end, they generate 10,000 random sightlines through a given cloud complex (i.e., they do the procedure shown in Figure 2 10,000 times) and analyze the properties of the absorption in aggregate (such as by counting the number of intersected absorbers). One key metric to quantify these effects is the observed equivalent width, which basically measures the strength/depth of an absorption feature—a sightline that passes through a high density of absorbers will have a larger equivalent width than one that intersects only a few. For example, from Figure 3, they show that decreasing the minimum cloudlet mass, which should increase the total number of cloudlets (as we saw in the leftmost panel of Figure 1) increases the number of intersected cloudlets, as you might expect. Because these cloudlets are much more common, there are more sightlines that will pass through a lower density column of gas, yielding a broader distribution of column densities. Despite these effects, the overall distribution of observed equivalent widths is roughly independent of minimum cloudlet mass, but the fraction of sightlines that yield a given equivalent width is significantly different between the different minimum masses.
This cloud complex model can be applied in aggregate to ‘simulate’ the distribution of clouds in the CGM halo around the galaxy. That is, several of these complexes will populate the CGM around a galaxy, so a given sightline will intersect a number of complexes, each of which is composed of a collection of cloudlets as we’ve seen. Applying this procedure to such a distribution allows one to predict observed line profiles and thus equivalent width distributions, a key observable used to probe the CGM.
Comparing the observed and predicted distributions and the sensitivity of these distributions to underlying parameters will shed light on the detailed structure of this complex medium.
Astrobite edited by Jessie Thwaites
Featured image credit: adapted from unsplash