Authors: XRISM Collaboration
First Author’s Institution: Department of Astronomy, University of Michigan
Status: Published in ApJ [open access]
Today we’re going to be taking a high resolution look at X-rays from close to a supermassive black hole! But before we get into the astrophysics of today’s paper, we first need to discuss the instruments that were built to do this science. Over 50 years ago now, charge-coupled devices (CCDs) began revolutionizing astronomy, and they continue to be one of the most commonly used detectors on telescopes. CCDs rely on the photoelectric effect, through which an incoming photon can liberate electrons in some material (semiconductors in the case of CCDs). These electrons are trapped by strong potential wells and electric charge can be applied to move the charge along and read this signal (check out this Astrobite for more details). CCDs are particularly powerful in the X-ray band, where the number of electrons trapped in each pixel scales roughly with the photon energy. This means that you get energy information (i.e. a spectrum) for free with CCDs! However, CCDs have limited spectral resolution, meaning they can’t determine this energy very precisely and therefore cannot resolve and unlock the power of narrow emission and absorption lines.
X-ray Microcalorimetry & 20/20 Vision
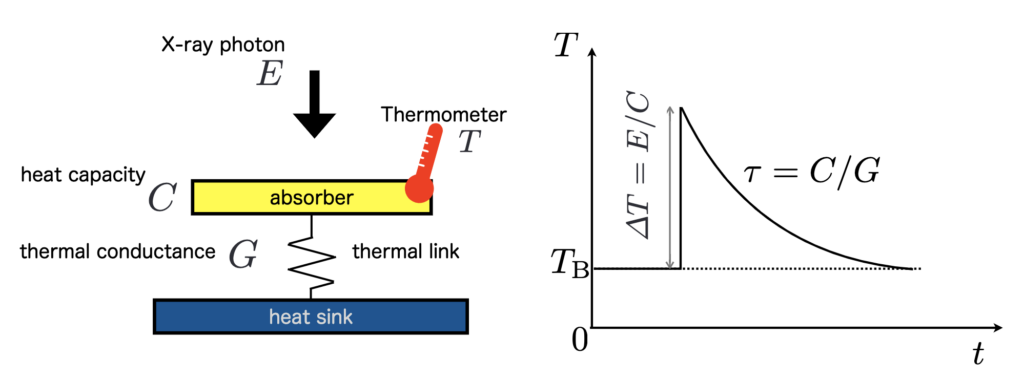
There are other ways to get better spectral resolution in the X-rays, including using gratings that will disperse your spectrum, as is commonly done with optical spectroscopy. However, even these techniques can’t reach the high spectral resolution needed; instead, new technology called a microcalorimeter has been engineered to solve this long-standing issue. As the name suggests, this instrument detects incoming photons by measuring tiny (micro) changes to the temperature (calorimetry) of the detector. Figure 1 shows the basic set-up of a microcalorimeter and how the energy of the photon is encoded in the strength of the resulting temperature fluctuation. In order to detect tiny changes to the temperature, microcalorimeters need to be extremely cold, 50 milli-Kelvin to be precise! This is a huge engineering feat, but one that has recently been achieved by the X-ray Imaging and Spectroscopy Mission (XRISM)! XRISM is a JAXA/NASA collaborative mission, and it has two instruments on board: a CCD camera called Xtend and a microcalorimeter called Resolve. It was launched in September 2023, and its first science results are just starting to roll in!
Now, XRISM isn’t actually the first X-ray microcalorimeter to fly, but it’s the first to live through its commissioning phase! Although the X-ray microcalorimeter has been in the works since the 1990s, previous X-ray microcalorimeters have been cut from missions, lost to launch failures, and been unable to operate due to loss of coolant for the detector. In 2016, JAXA successfully launched and operated the first X-ray microcalorimeter on the Hitomi Satellite. However, unfortunately shortly after taking a beautiful spectrum of the Perseus Cluster, one of the best studied galaxy clusters in the local universe, communication was lost with the satellite and never recovered. XRISM’s Resolve instrument has been the most successful X-ray microcalorimeter so far, and has allowed us to start looking at the universe with 20/20 X-ray vision!
Supermassive Science with XRISM
Today we’re going to put on our high-resolution X-ray spectroscopy glasses to look at one of the first XRISM targets – NGC 4151, one of the most well-known active galactic nuclei (AGN) in the local universe. An AGN consists of a supermassive black hole (SMBH) that is gobbling down gas from its surroundings through a process known as accretion. While we’ve known about AGN for 50+ years now, we still don’t really understand how they are fueled and what the structure is around them. XRISM can unlock this information indirectly by resolving some of the key X-ray emission and absorption lines. In particular, the most prominent emission line in AGN X-ray spectra is a neutral iron Kα line at 6.4 keV, which arises from material around the SMBH being illuminated by the light from the accretion process. This line holds the keys to probing the structure of the surrounding gas, as its dynamics can tell us about the structure of the accretion disk and trace gas in the torus that is thought to connect the local host galaxy to the accretion flow.
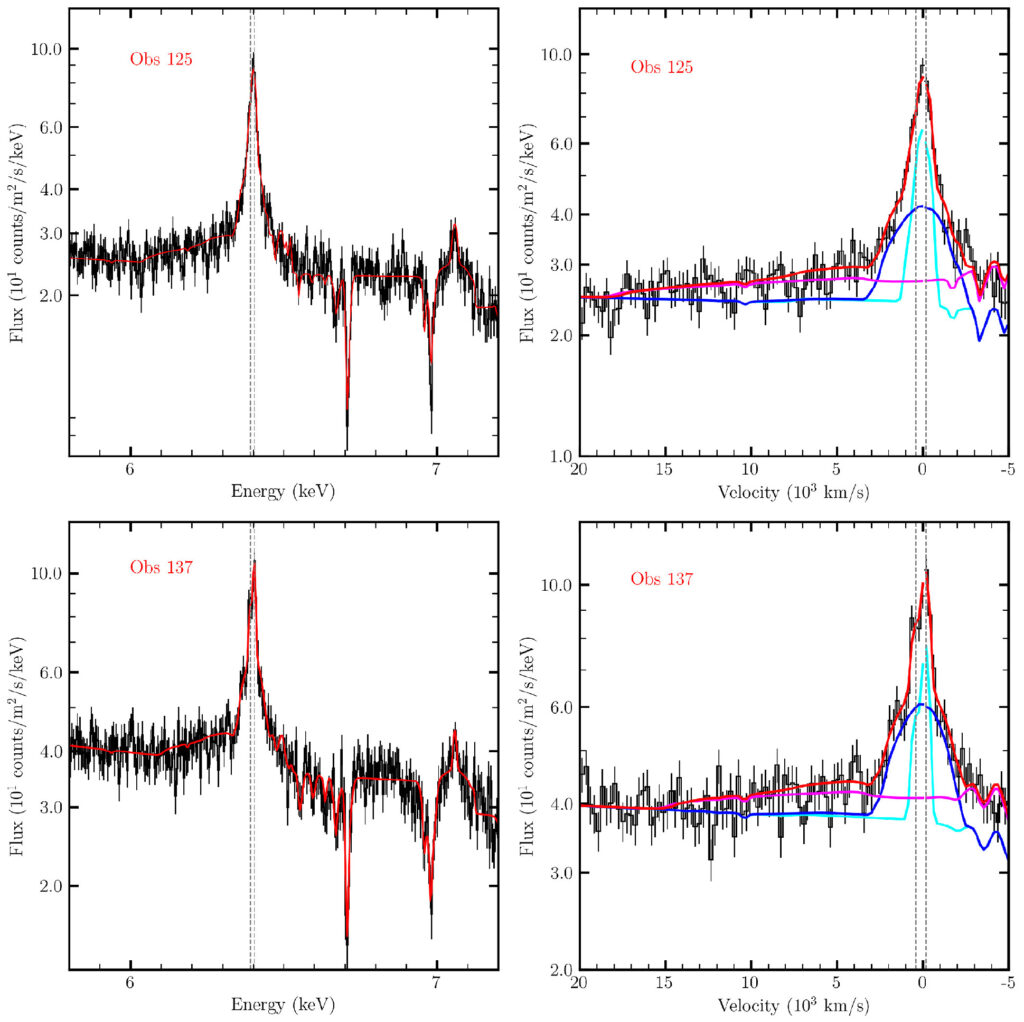
Figure 2 shows the XRISM Resolve spectrum of NGC 4151 from two separate observations. The spectrum shows a prominent 6.4 keV line that is resolved, meaning that the measured width of the line is greater than the instrument’s resolution limit. Additionally, the line cannot be fit with a single emission line and instead requires multiple lines, signalling multiple physical scales contributing to this emission line. The right panels of this figure highlight that there are three distinct components to this emission line with broad (magenta), intermediate (dark blue), and narrow (cyan) widths. Since gas that is closer to the SMBH will be moving faster than more distant gas, the authors can use these line widths to estimate where this gas is located. They find that these three lines range from ~100 gravitational radii (~100 x the size of the SMBH) to ~10,000 gravitational radii. Determining the multi-scale nature of this line has been extraordinarily difficult to detect with other instruments due to their limited energy resolution!
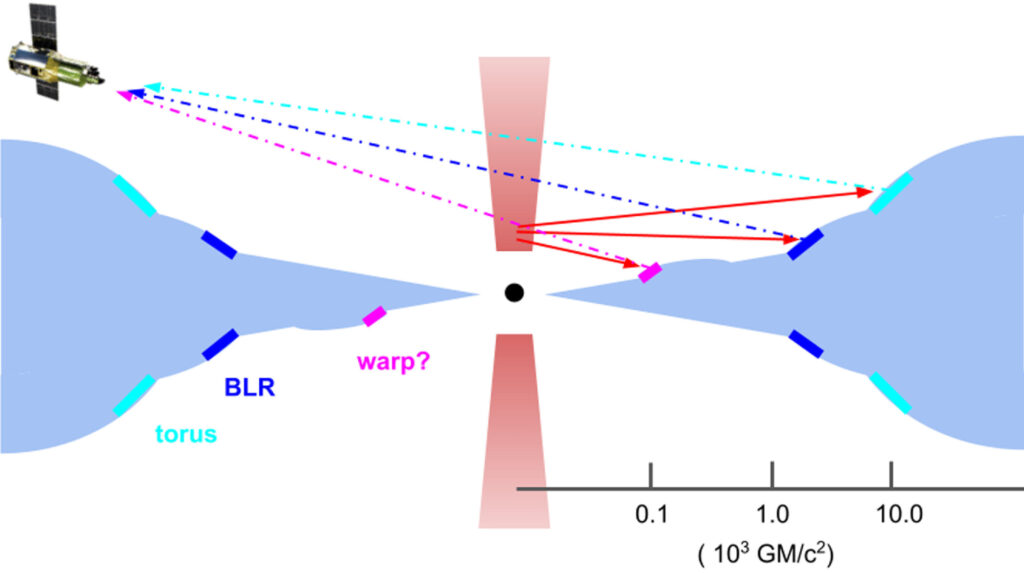
Together these three components to the iron Kα line provide a compelling picture for the nuclear structure, which is shown in Figure 3. There are some additional pieces of evidence from the data that support this model as well. For example, the broadest line (magenta) shows variability on timescales of less than a day. This timescales corresponds roughly to the distance light could travel before reaching the magenta part of this figure, supporting the idea that there is a broad component associated with the disk. In addition to the location of the emitting gas, the dynamics and density can be constrained using the energy and shape of the line, respectively. In this source, the line is at the rest frame energy and the shape is relatively symmetric, which together suggest that the emission comes from relatively optically thin gas that has not been accelerated to high velocities. Together, these diagnostics give one of the most in-depth pictures of SMBH environments to date and will be crucial for testing our models of SMBH feeding!
What’s Next?
These XRISM observations are rich with information, and today’s paper focused only on the 6.4 keV emission line. The authors are planning a series of further papers, including on the AGN winds traced by the absorption lines (i.e. the major dips seen at ~6.7 and ~7 keV in the left panels of Figure 2), comparisons of the emission lines with optical emission lines, and looking for faint evidence of broader emission from even closer to the SMBH. The next obvious steps are also to observe more AGN to test whether this multi-zone emission is a common occurrence in AGN. One thing’s for sure, this 20/20 vision is sure to reveal new secrets about the lives and environments of supermassive black holes!
Astrobite edited by Roel Lefever
Featured image credit: AGN Cartoon – JAXA, XRISM Image – JAXA/NASA, ROSAT Image – Max Planck Institute for Extraterrestrial Physics
Nice article, I enjoy it! I also appreciate the meme format in the thumbnail!