Title: The Atacama Cosmology Telescope: a census of bridges between galaxy clusters
Authors: G. Isopi, V. Capalbo, A.D. Hincks, et al.
First Author’s Institution: Sapienza Università di Roma, Università degli Studi di Roma Tor Vergata, INFN, INAF (Rome, Italy)
Status: Submitted to JCAP [open access]
In the standard model of cosmology used by astronomers today (known as the Λ Cold Dark Matter, or Λ CDM model), the composition of the universe is very well determined – it’s about 70% dark energy, 25% dark matter, and 5% baryons (regular matter). Almost as soon as this was worked out, astronomers noticed a huge issue – the amount of matter predicted by these measurements was more than ten times the amount of matter implied by the light they could see from stars and galaxies. This is known as the missing baryon problem.
Over time, solutions to this problem did start to develop. Firstly, with the discovery of the intracluster medium (hot, diffuse gas inside a galaxy cluster that doesn’t belong to any one galaxy) and then the circumgalactic medium (hot, diffuse gas on the outskirts of galaxies). The Lyα forest (diffuse neutral hydrogen in filaments between galaxies, visible as absorption lines in the spectra of bright background objects) also explained a lot of the missing matter, but that still only brought the total observable baryons up to about 46% of the matter the CMB suggested should be there – more than half of the baryons in the universe were still missing.
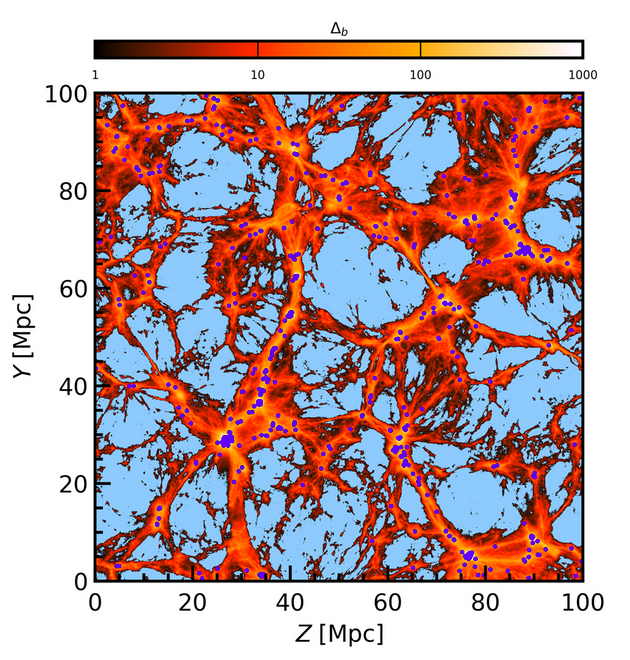
A solution was eventually suggested theoretically (and then backed up by hydrodynamical simulations) – what if these missing baryons were in filaments of plasma (ionized gas) stretching between galaxies? Simulations such as the one shown in Figure 1 suggested this gas would be at about 105-107 K (100-10,000 times room temperature), and about 10x the average density of the universe (for context, galaxy clusters are about 200x the average density of the universe). This is right in between the gas temperatures astronomers describe as ‘warm’ and ‘hot’ in other contexts, so it became known as the Warm-Hot Intergalactic Medium (WHIM), or more colloquially as the ‘cosmic web’.
Over the past ten years, observational evidence has started to come in for the WHIM existing. This is mostly indirect evidence, such as the dispersion measure of fast radio bursts (which are very quick, energetic pulses of radio emission originating mostly from galaxies outside of our own; the ‘dispersion measure’ measures the amount of plasma between the earth and the source of the burst, which is still largely unknown) being larger than could be explained by just the host galaxies (astrobite), or very energetic metal absorption lines being visible in quasar spectra (astrobite). Filaments of WHIM have also been detected stretching between pairs of galaxy clusters, in a bridge-like structure, although this has only been seen in a few individual exceptional objects. This is the observational signature that the authors of today’s paper go after, because it’s where you’d expect the WHIM to be brightest. Instead of looking at single objects, however, this paper targets a whole population of them.
Typically, astronomers measure plasma around galaxies and clusters using an effect known as the Sunyaev-Zel’dovic effect (or SZ effect; named after its two discoverers). This is the measurement of photons from the Cosmic Microwave Background (CMB) running into loose, fast-moving electrons in the plasma and gaining some energy from those electrons. The CMB has an extremely characteristic energy spectrum – it has the blackbody spectrum of the thermal emission from the opaque gas that made up the universe at early times, which was all the same temperature to more than one part in 25,000. This means that when higher-energy photons show up in the spectrum they’re very noticeable. Critically, the strength of the SZ effect isn’t affected by the redshift of the plasma, so it’s great for measuring high-redshift galaxy clusters.
The authors of today’s paper use the SZ effect to find pairs of galaxy clusters that are nearby each other, using a survey done using the Atacama Cosmology Telescope (ACT), a sub-mm telescope that was located in the Atacama desert in Chile. They found galaxy clusters that were fairly close together, and didn’t have any other clusters nearby to confuse the situation. Then, they simply averaged them together! This is a very common technique in astronomy, known as stacking or coaddition. Averaging together a population of images reduces the noise in the average, making it easier to see anything faint that might be common to all of the images – it’s a technique for maximizing the signal-to-noise ratio. This technique has been used before to address this same problem, although it was looking at pairs of individual galaxies instead of pairs of galaxy clusters (astrobite here!). The stacked image, showing the average of all the pairs of galaxy clusters and the potential bridges between them, is shown in Figure 2.
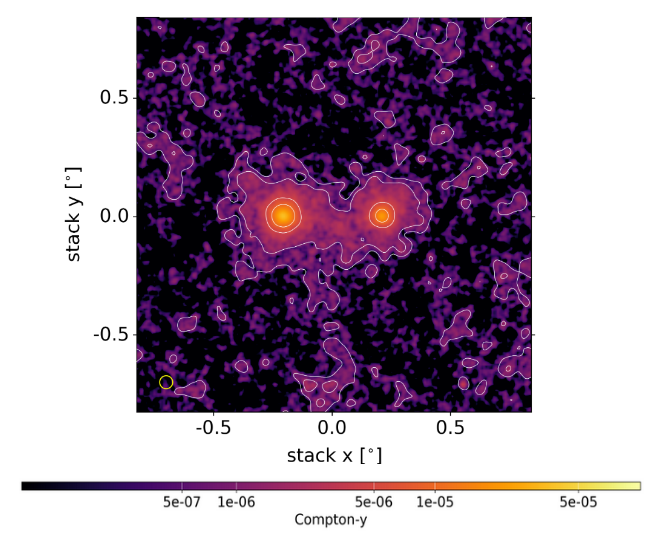
In order to confirm that the faint bridge they were seeing in the stacked image was actually real, and measure how bright it was, the authors fit a model of two galaxy clusters and a cylindrical filament to the image. They found an excess SZ signal of 7 ± 2 x 10⁻⁷, which is 3.3 standard deviations above what can easily be explained by random noise. The typical threshold astronomers use for confidently detecting something is 3 standard deviations, so this is a detection of a filament in the average image, but a faint one. They also show that the standard deviation of the stacked filament is not much larger than the rest of the stacked image. This suggests that the stack is not dominated by a few very bright filaments between the galaxy cluster pairs being averaged in, but is instead more likely the average of many fainter filaments, implying that filaments are pretty ubiquitous between close pairs of galaxy clusters. They did, however, find four galaxy cluster pairs that had tentative evidence for a bridge between them even in the individual images.
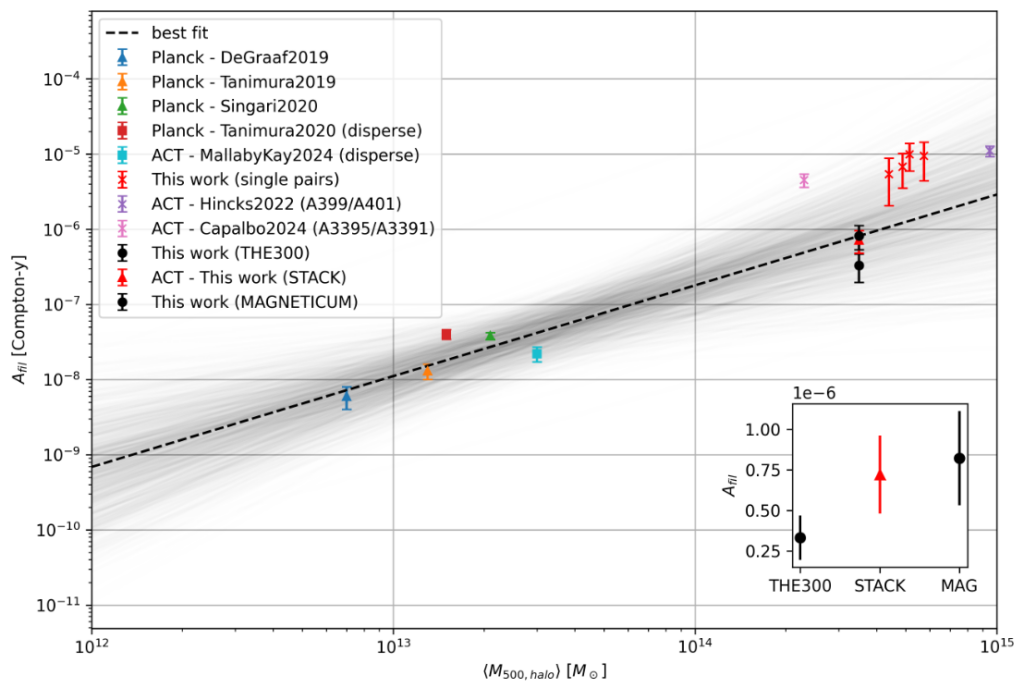
Finally, the authors compared their filament measurement to other measurements that have been done, relating the mass of the galaxy clusters making up their average to the brightness of the filament. This relationship is shown in Figure 3. The plot shows a likely scaling relation between the mass and the size of the filaments, where the filaments get bigger as the objects they’re stretching between get more massive. This is pretty intuitive, but it’s very nice to confirm it quantitatively!
There are other quantities it would be great to learn about the plasma in the filament (things like its density or temperature), but unfortunately the authors need more observations in different wavelengths (primarily x-ray) to confidently measure these quantities. More, and deeper, observations of the SZ effect are also needed to make the filament detection stronger, and to begin to detect individual filaments confidently. Still, this is a strong step towards understanding a mystery that’s been bothering astronomers for more than thirty years!
Astrobite edited by Jack Lubin
Featured image credit: Abell 1758, NASA / CXC / SAO / G. Schellenberger et al / SDSS.