by Noah Franz

Noah is a second-year astronomy graduate student at the University of Arizona. His research focuses on multiwavelength (but mostly radio) observations of high-energy transients. He is very passionate about writing and promoting reusable astronomy codes and is currently working on software infrastructures for his high-energy transient research. Outside of astronomy, he likes to spend time outdoors mountain biking, skiing, and hiking. You can learn more about Noah at his personal website: https://noahfranz13.github.io.
Title: Mapping the Inner 0.1 pc of a Supermassive Black Hole Environment with the Tidal Disruption Event and Extreme Coronal Line Emitter AT 2022upj
Authors: Megan Newsome, Iair Arcavi, D. Andrew Howell, Curtis McCully, Giacomo Terreran, Griffin Hosseinzadeh, K. Azalee Bostroem, Yael Dgany, Joseph Farah, Sara Faris, Estefania Padilla-Gonzalez, Craig Pellegrino, Moira Andrews
First Author’s Institution: Department of Physics, University of California, Santa Barbara
Status: Submitted to The Astrophysical Journal [open access]
Destroying a star
A Tidal Disruption Event (TDE) occurs when a star is torn apart after approaching a supermassive black hole (SMBH) close enough that the tidal forces rip it apart. This produces temporary (or “transient”) luminous emission that lasts about a year and can often be observed across the entire electromagnetic spectrum. While unfortunate for the star, observing this event is exciting for eager astronomers because it provides a unique probe of the environment surrounding SMBHs, helping improve our understanding of both galaxies and black holes.
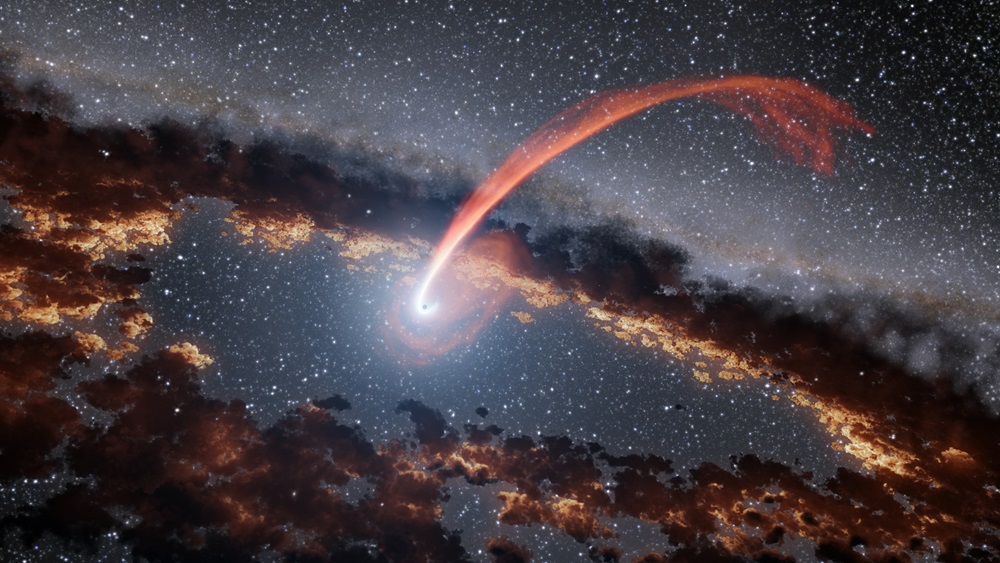
During the short period when light escapes the system, it propagates through, and interacts with, all of the gas and dust surrounding the SMBH (imagine something like Figure 1). As the emission from the TDE propagates through the surrounding gas, it produces spectral lines that indicate the presence of hydrogen and/or helium gas that is quickly orbiting the SMBH. Thus, studying this emission probes the properties of both the gas and the central SMBH!
Examining the remains
Today’s paper demonstrates the usefulness of another set of spectral lines, called Extreme Coronal Lines, for understanding the other elements within about half a light year of the central SMBH. ”Coronal lines” occur when very energetic photons, like X-rays, collide with gas containing heavy elements, like iron and sulfur, ejecting a bunch of electrons from the atom (usually 6 to 9 electrons). Coronal lines were first observed in the Sun’s Corona, giving them their misleading name. However, they have recently also been observed in the energetic environments at the centers of some galaxies. Any event that produces very luminous coronal emission lines is called an ”Extreme Coronal Line Emitter” (ECLE).
Transient ECLEs have been observed to dim with time at about the same rate as TDEs. Since TDEs also produce the very energetic emission necessary for ECLEs to occur, the transient ECLEs are hypothesized to be connected to TDEs. Past studies have been able to statistically link coronal lines and TDEs. But, until today’s paper, the appearance of extreme coronal lines has never been observed to occur at the same time as the TDE emission.
Connecting the two events

The authors of today’s paper measured the spectrum of the Astronomical Transient (AT) AT 2022upj to understand the contents of the gas around it. This first spectrum, shown in the top line of Figure 2, reveals features consistent with both TDEs (hydrogen and helium lines) and ECLEs (high-energy iron and sulfur lines). This caught the authors’ attention because it is the first time extreme coronal lines have occurred at the same time as the TDE emission. The authors ensure that the extreme coronal lines occur because of the high energy X-ray emission from the TDE, rather than another source in the galaxy, by comparing archival X-ray observations of the TDE host galaxy. The authors found no previous emission energetic enough to produce coronal lines so they argue that the coronal lines must be due to the TDE.
Curiously, the extreme coronal lines appeared earlier than ever before observed in a TDE. After their initial discovery, the authors continued to take spectra of the TDE until about 400 days after their first spectrum. This gave the authors a long timeline of ECLE spectra, which allowed them to discover variability in the coronal lines (Figure 2). They argue that this is due to onion-like layers of gas content present in the galaxy’s nucleus (Figure 3).
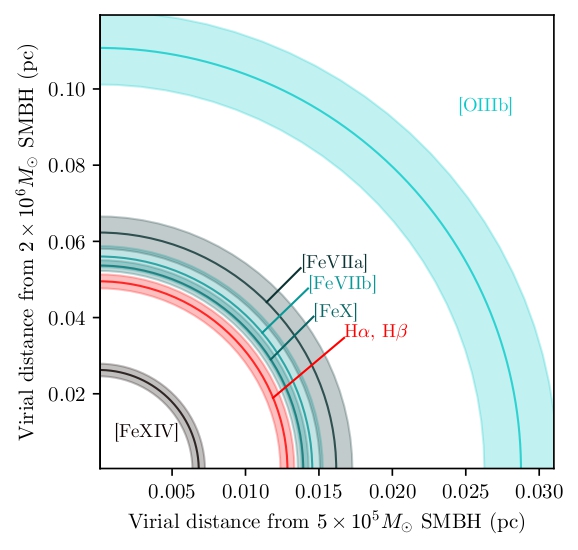
Finally, the authors use their observations to calculate gas velocities from the spectral lines originating from each of these layers (see this fantastic astrobite review). Combining this velocity with a measurement of the SMBH mass allows them to map the radius of different ionized gasses in the center of the host galaxy of AT 2022upj (Figure 3). This map provides observational insights at the smallest scales to date into how energetic events, like TDEs, can change the gas surrounding SMBHs in the center of galaxies. Future studies will now likely build on this methodology to continue to produce these maps and explore the complex environments surrounding SMBHs at even smaller scales.
Astrobite edited by Sowkhya Shanbhog
Featured image credit: NASA/JPL