The Undergraduate Research series is where we feature the research that you’re doing. If you are an undergraduate that took part in an REU or similar astro research project and would like to share this on Astrobites, please check out our submission page for more details. We would also love to hear about your more general research experience!

My name is Diya Talesara, and I am an undergraduate student in Astronomy and Astrophysics at the University of the Witwatersrand, South Africa. I am passionate about exploring exoplanets, black holes, and the atmospheres of planets within our solar system through the study of various types of radiation. Driven by curiosity and a deep fascination with the universe, I aspire to make a meaningful contribution to the field of astronomy.
Imagine being able to detect alien life from the comfort of your very home with nothing but a nice cup of coffee, some data and your computer. Infrared radiation is turning this vision into a reality.
Why is the infrared spectrum so special? How does it contribute to our understanding of space?
Infrared radiation has played a crucial role in advancing exoplanet studies, as it allows us to observe the spectra of important biosignatures. Biosignatures are chemical clues—like methane, water vapor, or oxygen—that could indicate the presence of life, since these molecules are often produced by biological processes. The research project I did explored how infrared analysis helps identify various molecules in the cosmos and examines the implications of these discoveries for our understanding of extraterrestrial environments.
Infrared radiation is divided into three categories based on wavelength and proximity to visible light: far-infrared radiation, mid-infrared and near-infrared.
Infrared radiation has unique properties that makes it useful in many fields. For example, it can help identify molecules, reveal molecular structures, assist in medical scanning, and power technologies like laser radar. One of its most important features is the absorption spectrum—a kind of molecular fingerprint that shows how different substances absorb light at specific wavelengths.
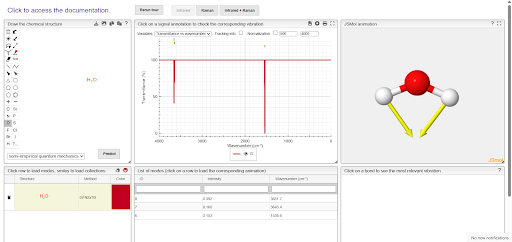
When electrons jump between energy levels, they produce patterns of light absorption or emission called spectra—like molecular barcodes. Each molecule has a unique spectrum based on its structure. This is crucial in the search for life, as scientists examine the spectra from exoplanets to detect chemical biosignatures such as carbon, methane, water, and phosphorus. According to UNSW Sydney, detecting life on exoplanets involves observing these specific molecular signatures.Spectra can be explored using an interactive model from ChemInfo.The model allows the user to build molecules and displays their infrared spectra (transmittance vs. wavenumber), along with the types of rotations relevant to each molecule. Transmittance refers to the percentage of light that passes through without being absorbed. For example, a transmittance of 100% means that all the light at that wavelength passes through the material unchanged—no light is absorbed. On the other hand, when the graph shows troughs (dips), it means that light at those specific wavelengths is being absorbed by the material. These dips are called absorption bands. The wavenumber tells us the exact position of each absorption band along the spectrum.
From this model, a transmittance vs. wavelength graph shows how much light passes through a material at different wavelengths. Using this understanding, I examined the spectra of the exoplanet 2MASS J12073346-3932539 b, a planet about five times the size of Jupiter that orbits a star similar to our Sun.All the data for this exoplanet is available via the exoplanet archive. This data was plotted into a flux versus wavelength graph using a Python program. With the help of libraries such as Pandas, NumPy, and SciPy, absorption lines were identified by locating the troughs in the graph. This method mirrors the approach described in the introduction when analyzing the H2O molecule and its interactive model.
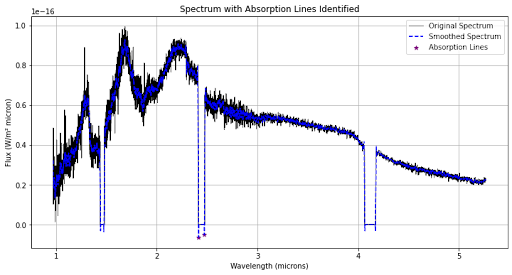
All “dips” in the graph were identified and noted. Using the HITRAN database, which lists molecules and their corresponding wavelengths, different molecules were identified.
I selected several important bio-signature molecules—such as water (H₂O), carbon dioxide (CO₂), nitrous oxide (N₂O), hydrogen (H₂), and sulfur dioxide (SO₂)—and identified the wavenumbers associated with each. After careful analysis, the most prominent absorption features matched nitrous oxide, sulfur dioxide (specifically the isotope SO₂-³²), and deuterium (a heavier form of hydrogen). The first set of absorption dips corresponded to carbon dioxide and methane (CH₄), while the third set matched ozone (O₃), another form of sulfur dioxide (SO₂-³³), and normal hydrogen.
For example, one of the distinct absorption troughs appeared at 4139.6 cm⁻¹, which falls within the range 4129.6–4149.6 cm⁻¹. According to the HITRAN database, this matches sulfur dioxide (SO₂-³³).
In summary, hydrogen and sulfur dioxide—appearing in different forms—were common among the absorption features. Scientific studies confirm the presence of hydrogen and methane on this planet, showing that the methods used here were effective for identifying atmospheric molecules.
This is really exciting because sulfur dioxide (SO₂), which usually comes from volcanic eruptions—showing that this planet might have active geology shaping its atmosphere. Hydrogen (H₂) showed up too, including a heavier version called deuterium, which plays an important role in many chemical reactions. Each of these molecules leaves a unique “fingerprint” in the infrared spectrum, and together they paint a fascinating picture of this world’s atmosphere—one that might just hold the clues to life beyond Earth
This demonstrates the incredible power of infrared radiation, allowing even an ordinary astronomer to make groundbreaking discoveries right at their fingertips.
Astrobite edited by: Lindsey Gordon
Featured Image: Cat’s Eye Nebula