The Undergraduate Research series is where we feature the research that you’re doing. If you are an undergraduate that took part in an REU or similar astro research project and would like to share this on Astrobites, please check out our submission page for more details. We would also love to hear about your more general research experience!

Natalie Price is a recent graduate from Whitman College, earning a Bachelor of Arts in Astronomy. She completed this research under the mentorship of Dr. Jessica Sutter. She presented these results, along with other work involving nearby galaxies and the [CII] Deficit, at AAS 246, APS 2025, CU*IP 2025, and the 2025 Whitman Undergraduate Conference.
[CII] in the Triangulum Galaxy
M33, or the Triangulum Galaxy, is a flocculent dwarf spiral galaxy, a galaxy appearing almost “fluffy” with poorly defined arm structures, located near the Andromeda Galaxy at a distance of 280,000 light years away. As one of the nearest face-on spiral galaxies, it is prime real estate for astronomers hoping to make observations with high resolution and low attenuation, by which the light from galaxies gets dimmed due to interstellar dust. Since Triangulum is so close, astronomers can measure individual stellar nurseries, the clouds of gas and dust where stars are actively forming, in all parts of the electromagnetic spectrum, including the far-infrared (FIR).
At far-infrared wavelengths lies the singly ionized carbon, [CII] (C-plus) emission line. As seen in Figure 1, this line acts to remove energy from the galaxy, as its long wavelength can escape the dust of the galaxy with minimal attenuation.
![Infographic of [CII] emission line.](https://astrobites.org/wp-content/uploads/2025/06/HowCII158micronemissionisproducedinphotodissociationregionsPDRs-ezgif.com-video-to-gif-converter.gif)
Figure 1: Ultraviolet emissions from young stars heat up the surrounding dust and gas in stellar nurseries. As this emission encounters [CII], it is absorbed and reemitted in the far-infrared, carrying energy out of the interstellar medium. Animation made by Rodrigo Hererra-Camus (University of Maryland).
However, as rates of star formation increase in observations, the ratio of [CII] to the far-infrared flux decreases. Newborn stars emit in the ultraviolet (UV), and it is assumed that these UV emissions get attenuated by dust in the interstellar medium (ISM) and re-emitted in the far-infrared, making the far-infrared flux an indicator of ISM heating via star formation. An unbalanced cooling to heating ratio ([CII]/FIR), suggests that in starbursting galaxies like Triangulum that have extremely high rates of star formation, thermal energy is being removed less efficiently, or other prevalent emission lines take over. The variation in this ratio suggests that [CII] is not an accurate tracer of star formation like the far-infrared flux. In the high redshift universe, the far-infrared spectrum becomes the dominant wavelength range of study, with [CII] being an easily detectable emission line and therefore understanding of the [CII] Deficit becomes crucial to minimizing error.
Measuring the [CII] Deficit
Without a far-infrared observatory, measurements of the far-infrared flux can be estimated using computational codes such as CIGALE (Code Investigating Galaxy Emission). CIGALE models what the galaxy’s spectra may look like using known fluxes from other portions of the electromagnetic spectrum. Using the wealth of archival photometry available for M33, I was able to predict what the far-infrared flux from M33 may look like. With this estimate, I measured the [CII] Deficit in M33.
We found a noticeable [CII] Deficit in M33, however, it declined at a lower rate when compared to previous work in nearby spiral galaxies NGC 3627 and NGC 1365. It also built upon and extended the deficit trend seen in measurements of large samples of galaxies such as the KINGFISH (Key Insights in Nearby Galaxies: A far-infrared Survey with Herschel) sample, as seen in Figure 2.
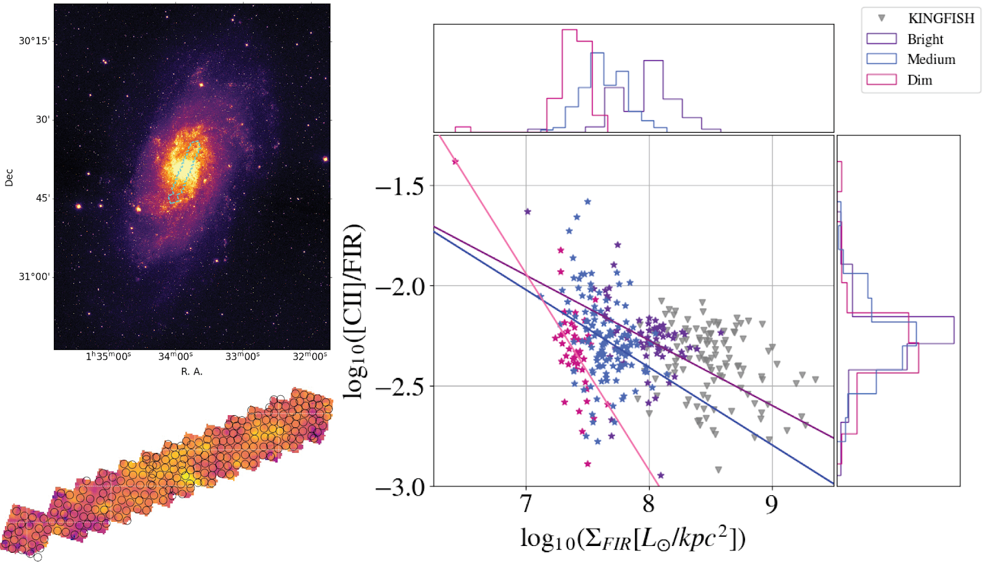
Figure 2: The [CII] Deficit for M33, as seen in the decreasing [CII]/FIR ratio with respect to the far-infrared surface brightness, along with three varying H-alpha trends and their best fit lines, along with the KINGFISH sample. On the top left is an image of M33, with Natalie’s [CII] coverage map overlaid. On the bottom left is a map of the strength of the [CII] emission line.
[CII] and the H-alpha Emission Line
The H-alpha emission line, an n=3 to n=2 Balmer series transition, is the most commonly used tracer of star formation. However, due to the fact that it has a wavelength of 656.46 nanometers, at the redder end of the visible spectrum, it cannot be used with corrections for attenuation due to dust in the galaxy. We used the H-alpha line in order to compare other methods of tracing star formation, and see if there were any correlations between the [CII] Deficit and H-alpha emission in M33. Shorter wavelengths of light, like H-alpha in the visible spectrum, are unable to escape dusty regions of the ISM without being attenuated by dust. This calls for a dust correction in order to understand exactly how much H-alpha we would expect without dust. Using a map of H-alpha emission in M33, we color coded our [CII] Deficit by three differing H-alpha strengths: bright, medium, and dim.
Within our [CII] Deficit, as seen in Figure 1, we found three different deficits that depended on the strength of the H-alpha line in that region. This suggests that the [CII] Deficit may be inherently linked to the H-alpha present in the region itself.
Through this work, we explored the [CII] Deficit in Local Group galaxy M33, and established a correlation between H-alpha, another tracer of star formation, and the [CII] Deficit. Further work on the [CII] Deficit is necessary to understand the root cause of the deficit, both in M33 and beyond in nearby galaxies where both [CII] and H-alpha are resolvable.
Astrobite edited by Shalini Kurinchi-Vendhan.
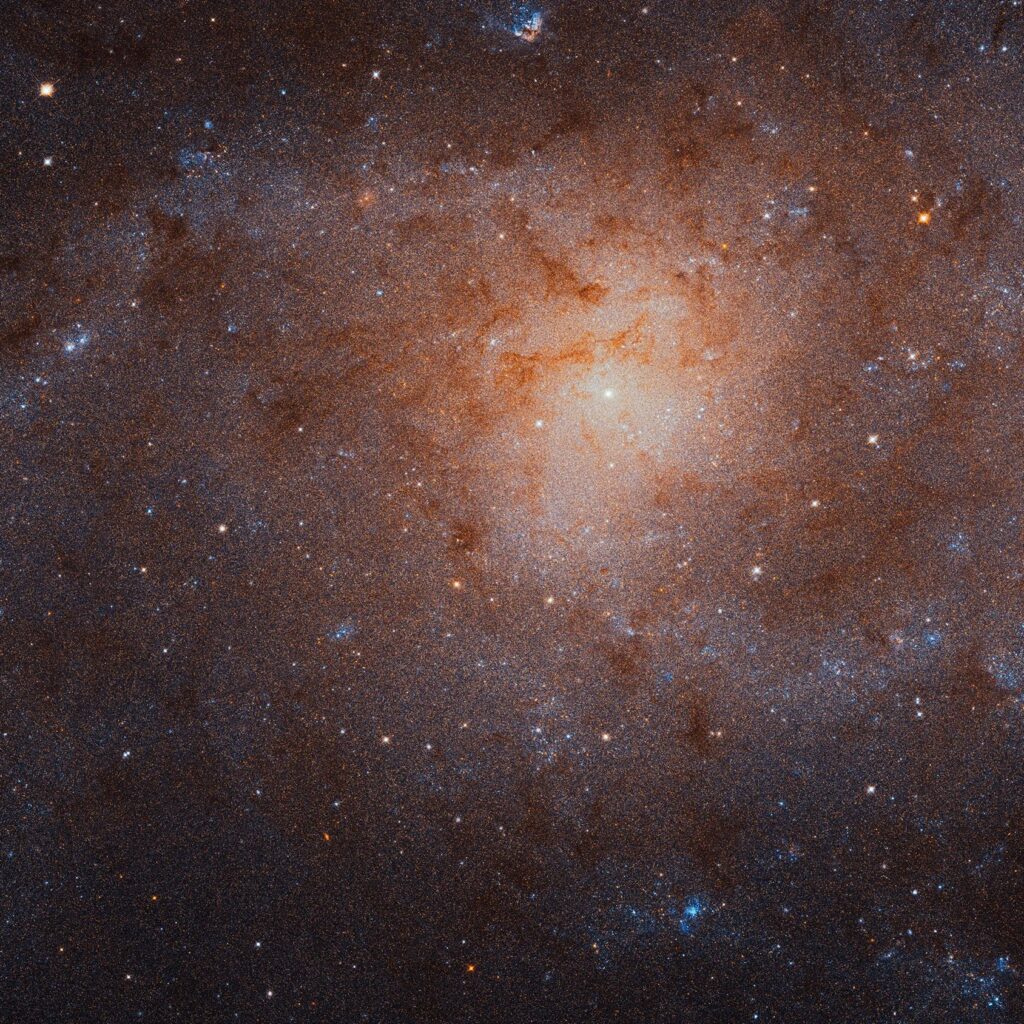
Featured image credit: Messier 33 (M33), also known as the Triangulum Galaxy, by NASA.