Today’s coverage is focused on the DESI DR2 results, which have been published today in the Physical Review Journal (see the published papers on their Astro website, go.aps.org/astro). For more information about Astrobites’ partnership with APS, see this Astrobite.
Paper titles: “DESI DR2 Results I: Baryon Acoustic Oscillations from the Lyman Alpha Forest” and “DESI DR2 Results II: Measurements of Baryon Acoustic Oscillations and Cosmological Constraints”
Authors: The DESI Collaboration
Paper status: Published in PRJ [open access]
As its name suggests, the goal of the Dark Energy Spectroscopic Instrument (DESI) is to pin down the unknown and elusive dark energy, which we think is not only causing our universe to expand but do so at an accelerated pace counteracting the gravitational attraction that pulls matter together. The latest set of results from DESI were published today in Physical Review D. These results, which form the collaboration’s “Data Release 2” (DR2), challenge our current best model of cosmology, ΛCDM. You can read about hints provided by the earlier Data Release 1, which came out in 2024, in this bite.
In today’s bite, we will outline some key results and measurements from DESI’s second data release. More discussion of the results and their cosmological implications are presented in these two follow-up bites covering the supporting papers.
Why: Dark Energy
It’s tempting sometimes to feel like we understand the universe really well. We have a great model called ΛCDM that can describe 14 billion years of cosmic history with only a handful of parameters. Among those parameters are the densities of the different types of stuff in the universe, like matter and radiation, and the current expansion rate. The Friedmann equations, which use gravity as described in general relativity to predict how a mix of components with different energy densities and pressures will expand or contract, can then be used to look into the universe’s past or future. Simple, right? Of course, if we start thinking about densities of stuff, we remember that as best we can tell, about 27% of the current energy density of the universe is dark matter and about 68% is dark energy, neither of which we really know what is, so…okay, okay, we still have a lot to understand about the universe.
A component of the universe like matter or radiation can be described by its equation of state parameter, w, which is the ratio of its pressure to its energy density. Energy density is energy per unit volume. The way energy density (and thus equation of state) of a component changes as the universe expands is an important part of how it affects the expansion. Intuitively, matter’s energy density dilutes in proportion to volume – the same amount of stuff is sitting in a bigger space – and part of the ΛCDM model (CDM=cold dark matter) is the assumption that dark matter dilutes the same way as regular matter. Radiation’s energy density actually dilutes faster than volume, because radiation gets redshifted as the universe expands and redder light has lower energy.
From supernova observations, we can see the expansion of the universe is accelerating. Matter and radiation should slow down expansion, not accelerate it; it takes something with an equation of state parameter w < -⅓ to cause accelerated expansion, and whatever that something is, we’re calling it dark energy. Until recently, dark energy has looked a lot like a cosmological constant, w = -1 (that’s the Λ in ΛCDM). What’s constant is energy density: as the universe expands, dark energy density stays exactly the same (which also means dark energy becomes more influential relative to matter and radiation as time goes on). This is consistent with spacetime itself having an inherent amount of energy per unit volume, which isn’t completely out there, but is not something we have a good handle on at all. And regardless of whether dark energy is a cosmological constant or not, it behaves completely unlike any other substance we know, and also it seems to currently make up the majority of stuff in the universe, and…surely this is something we want to know more about!
Just as the Friedmann equations allow us to predict future expansion if we know what components make up the universe, they allow us to know what components make up the universe if we know the past expansion. That’s DESI’s strategy to investigate the nature of dark energy: trace the past by observing a phenomenon called baryon acoustic oscillations (BAO).
How: Baryon Acoustic Oscillations
Given that DESI wants to observe the expansion history of the universe, it would be nice if the universe came printed with grid lines which could be seen to stretch over cosmic time. It doesn’t, but baryon acoustic oscillations are the next best thing.
Very early in the universe, it was too hot for atoms to form, and the universe was filled with a dense fluid of interacting protons, electrons, and photons. That baryon-photon fluid could carry sound waves – that is, pressure waves, termed baryon acoustic oscillations (BAO). Any initially overdense spot would try to spread out, launching a wave. The spherical ripples of higher density – like ripples on a pond, except in 3D – spread outward through the cooling universe until the time atoms formed and the pressure waves could no longer travel. At that point, the ripples froze into the density distribution of matter in the universe. When galaxies begin to form, more formed in the denser places where the edge of the ripples had been (as shown in this visualization).
The ripple – the BAO feature – had a characteristic size when it formed: the distance you could travel at the baryon-photon fluid’s speed of sound during the time the fluid existed. As the universe expanded afterwards, the overdensities of galaxies from the BAO were stretched with the overall expansion and can act as a standard ruler.
How: So Many Robots, Plus Statistics
Light from faraway galaxies takes time to travel to us, so we can look back in time by looking at more distant galaxies. We mentioned earlier that light gets redshifted as the universe expands; thus, the spectrum of a galaxy informs us how far back in the expansion history we’re looking. We can map how galaxies cluster at different redshifts, watch how the apparent size and shape of the BAO feature changes, and infer the expansion history of the universe.
This has been done before, starting with the Sloan Digital Sky Survey (SDSS), but DESI’s new results are the most precise BAO measurement ever made. The secret? Measure more galaxies! The secret to that? Robots! DESI takes spectra of 5000 objects at a time, thanks to robotic positioners that quickly carry spectrograph-feeding fiber optics to the locations of objects in its field of view. DESI is only in year three of five of operation, so the results will only get more precise. 14 million spectra are included in the current analysis, and the plan is to eventually take 40 million.
Just like you can see a flashlight from a few meters away but a lighthouse from many kilometers away, DESI looks at different galaxy types to see farther back in space and time. It also uses something called the Lyman-alpha forest, which works a little differently (more on that in a minute). The observations are divided up into bins by redshift, and then each bin is analyzed to give an overall picture of the expansion of the universe. A visual overview from the paper is shown in Fig. 1 below.
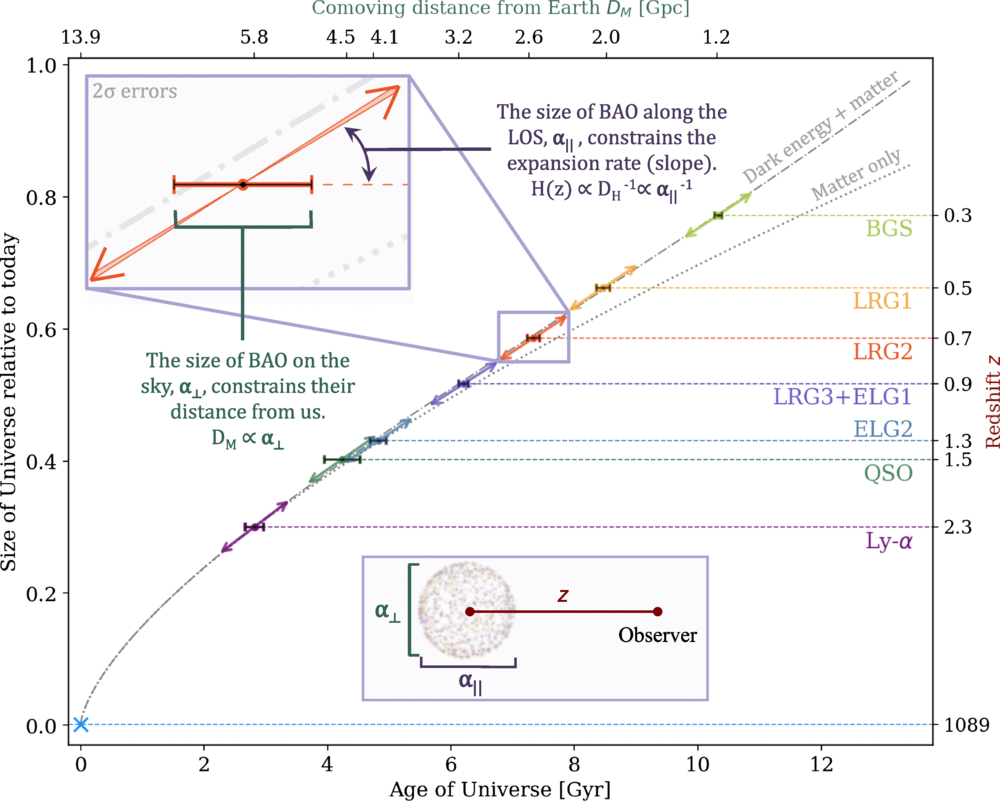
Fig. 1 (also figure 1 in Key Paper II). The expansion of the universe over time, as inferred from baryon acoustic oscillations! Each color indicates a different redshift bin, and the initials represent different object types (BGS=bright galaxy survey, LRG=luminous red galaxies, ELG=emission line galaxies, QSO=quasi-stellar objects aka quasars, Ly-ɑ=Lyman-alpha forest).
Baryon Acoustic Oscillations and the Lyman-ɑ forest
One way to track BAO at very large redshifts (from the early universe) is by studying spectra of distant quasars. But we’re not concerned with just the quasar spectra themselves—it’s more interesting to see how that light traveled to us. Along the way, photons with just the right wavelength were absorbed by neutral hydrogen in the intergalactic medium, exciting electrons via the Lyman-ɑ transition. This caused a dip at the Lyman-ɑ wavelength in the quasar’s absorption spectrum.
But remember, photons are continuously redshifted as the universe expands. So when they encountered a closer gas cloud, a different set of photons underwent Lyman-ɑ absorption, creating another dip. Every obstructing gas cloud along the line of sight thus produced its own dip, leaving behind a succession of spikes in the quasar’s absorption spectrum called the Lyman-ɑ forest.
In this way, the clustering of spikes in a quasar’s Lyman-ɑ forest traces the matter-density distribution at different redshifts along its path. This is invaluable information, because repeating this exercise with many quasars reveals the matter-density distribution along multiple directions in the sky. In turn, this lets us scope out BAO patterns over cosmic history.
The results are in!
Well, almost. To calibrate the BAO ruler, one first needs to add in some extra cosmological data to know what size the BAO were when they originally formed in the early universe. (The baryon density determined not only the speed of sound in the baryon-photon fluid but in what ratios different elements formed, so observed abundances of elements do the trick when combined with the cosmic microwave background temperature.) But with that out of the way, the DESI collaboration can begin fitting cosmological models and looking at the goodness-of-fit using chi-squared.
What happens when you fit to ΛCDM, where dark energy is a cosmological constant? The fit looks fine, but the resulting parameters don’t quite match what you get if you fit ΛCDM to the cosmic microwave background (CMB) or to supernova data, which come from much earlier and a little later in cosmic time, respectively, than the DESI BAO data.
What happens if you keep everything else we assume about the universe the same, but allow dark energy to vary over time? The authors fit a model called w0waCDM, where the dark energy equation of state parameter w = w0 + wa*(1-a). (a, called the scale factor, represents the size of the universe relative to the present size and is closely linked to redshift.) ΛCDM can be viewed as a special case of w0waCDM where w0 = -1 and wa = 0. But the BAO data fit slightly better if w0 > -1 and wa < 0. If you add either the CMB data or the supernova data to the w0waCDM fit, extending your reach in time, the preference for w0 > -1 and wa < 0 increases, and if you use both of them, it increases more. Combining all three data types, depending on what set of supernova data you use, the statistical preference for a time-varying dark energy equation of state is 2.8-4.2σ. This result is shown in Fig. 2.
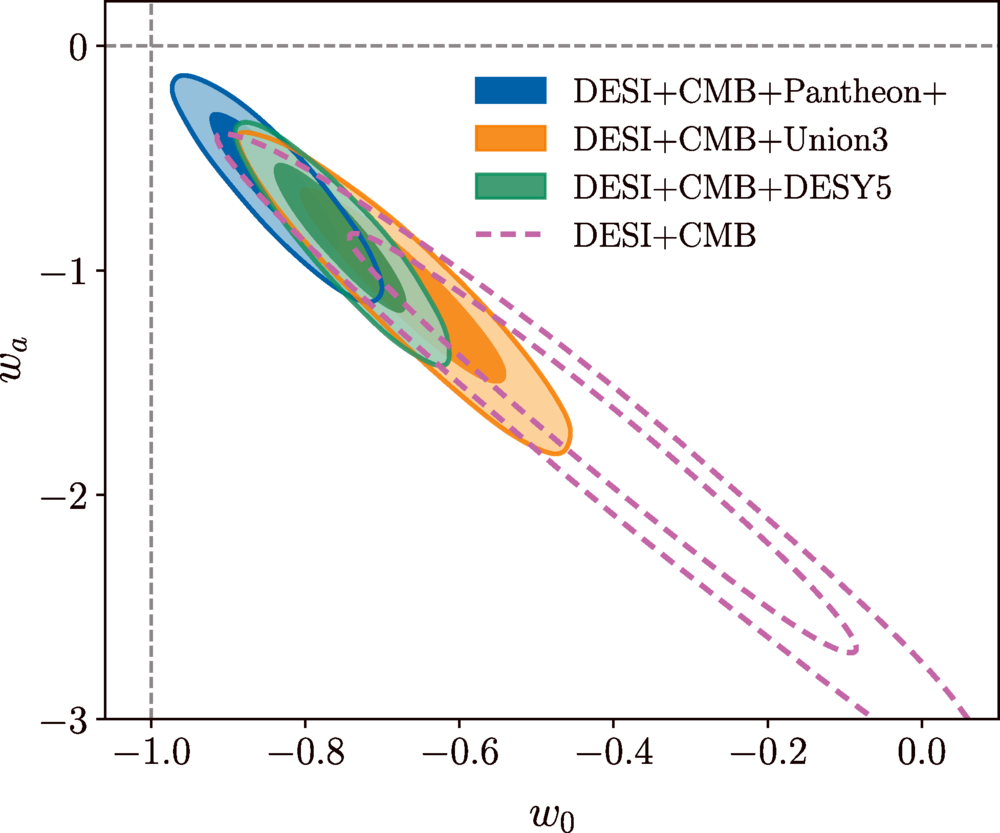
Fig. 2 (Fig. 11 from Key Paper II) The filled ovals represent the most likely combinations of w0 and wa based on the combination of the DESI DR2 BAO data, the cosmic microwave background, and supernovae. Each color represents the result of using a different supernova dataset. The pink unfilled oval uses just the BAO and CMB data. The inner oval and outer oval of each set represent where we’re 68% and 95% confident, respectively, that the right value lies within.
The DESI Data Release 1, back when fewer spectra had been taken, showed a similar preference for w0waCDM, and the statistical preference has only grown stronger as more data has been added. It isn’t quite at the threshold to be considered a discovery yet, but the hint is looking stronger and stronger.
If the preference for w0waCDM continues to grow, this would be a really big deal. ΛCDM has been our best model of the universe for almost 30 years, since dark energy was first discovered. It’s exciting to think about what comes next!
To read more of our coverage of the DESI DR2 Results, check out Part 2 and Part 3!
Footnote: What about the Hubble tension? You’ve probably heard that fitting ΛCDM to CMB data gives you a lower value of the Hubble constant H0 than fitting to supernova data, with a much greater difference between the values than what astronomers think the size of the uncertainty on either value should be. You can get a separate H0 measurement from the DESI BAO data and do your interpretation using w0waCDM, but the result is even lower than the CMB H0 – so the tension is not resolved at all! The mystery continues.
Edited by: Jessie Thwaites and Brandon Pries
Featured Image Credit: DESI Collaboration/KPNO/NOIRLab/NSF/AURA/P. Horálek/R. Proctor, via Wikimedia Commons (CCBY4.0)
.jpg#filelinks)
Correction: There was a typo in the journal in the original version of this article. The DESI papers were published in PRD, not PRL, which is now corrected.