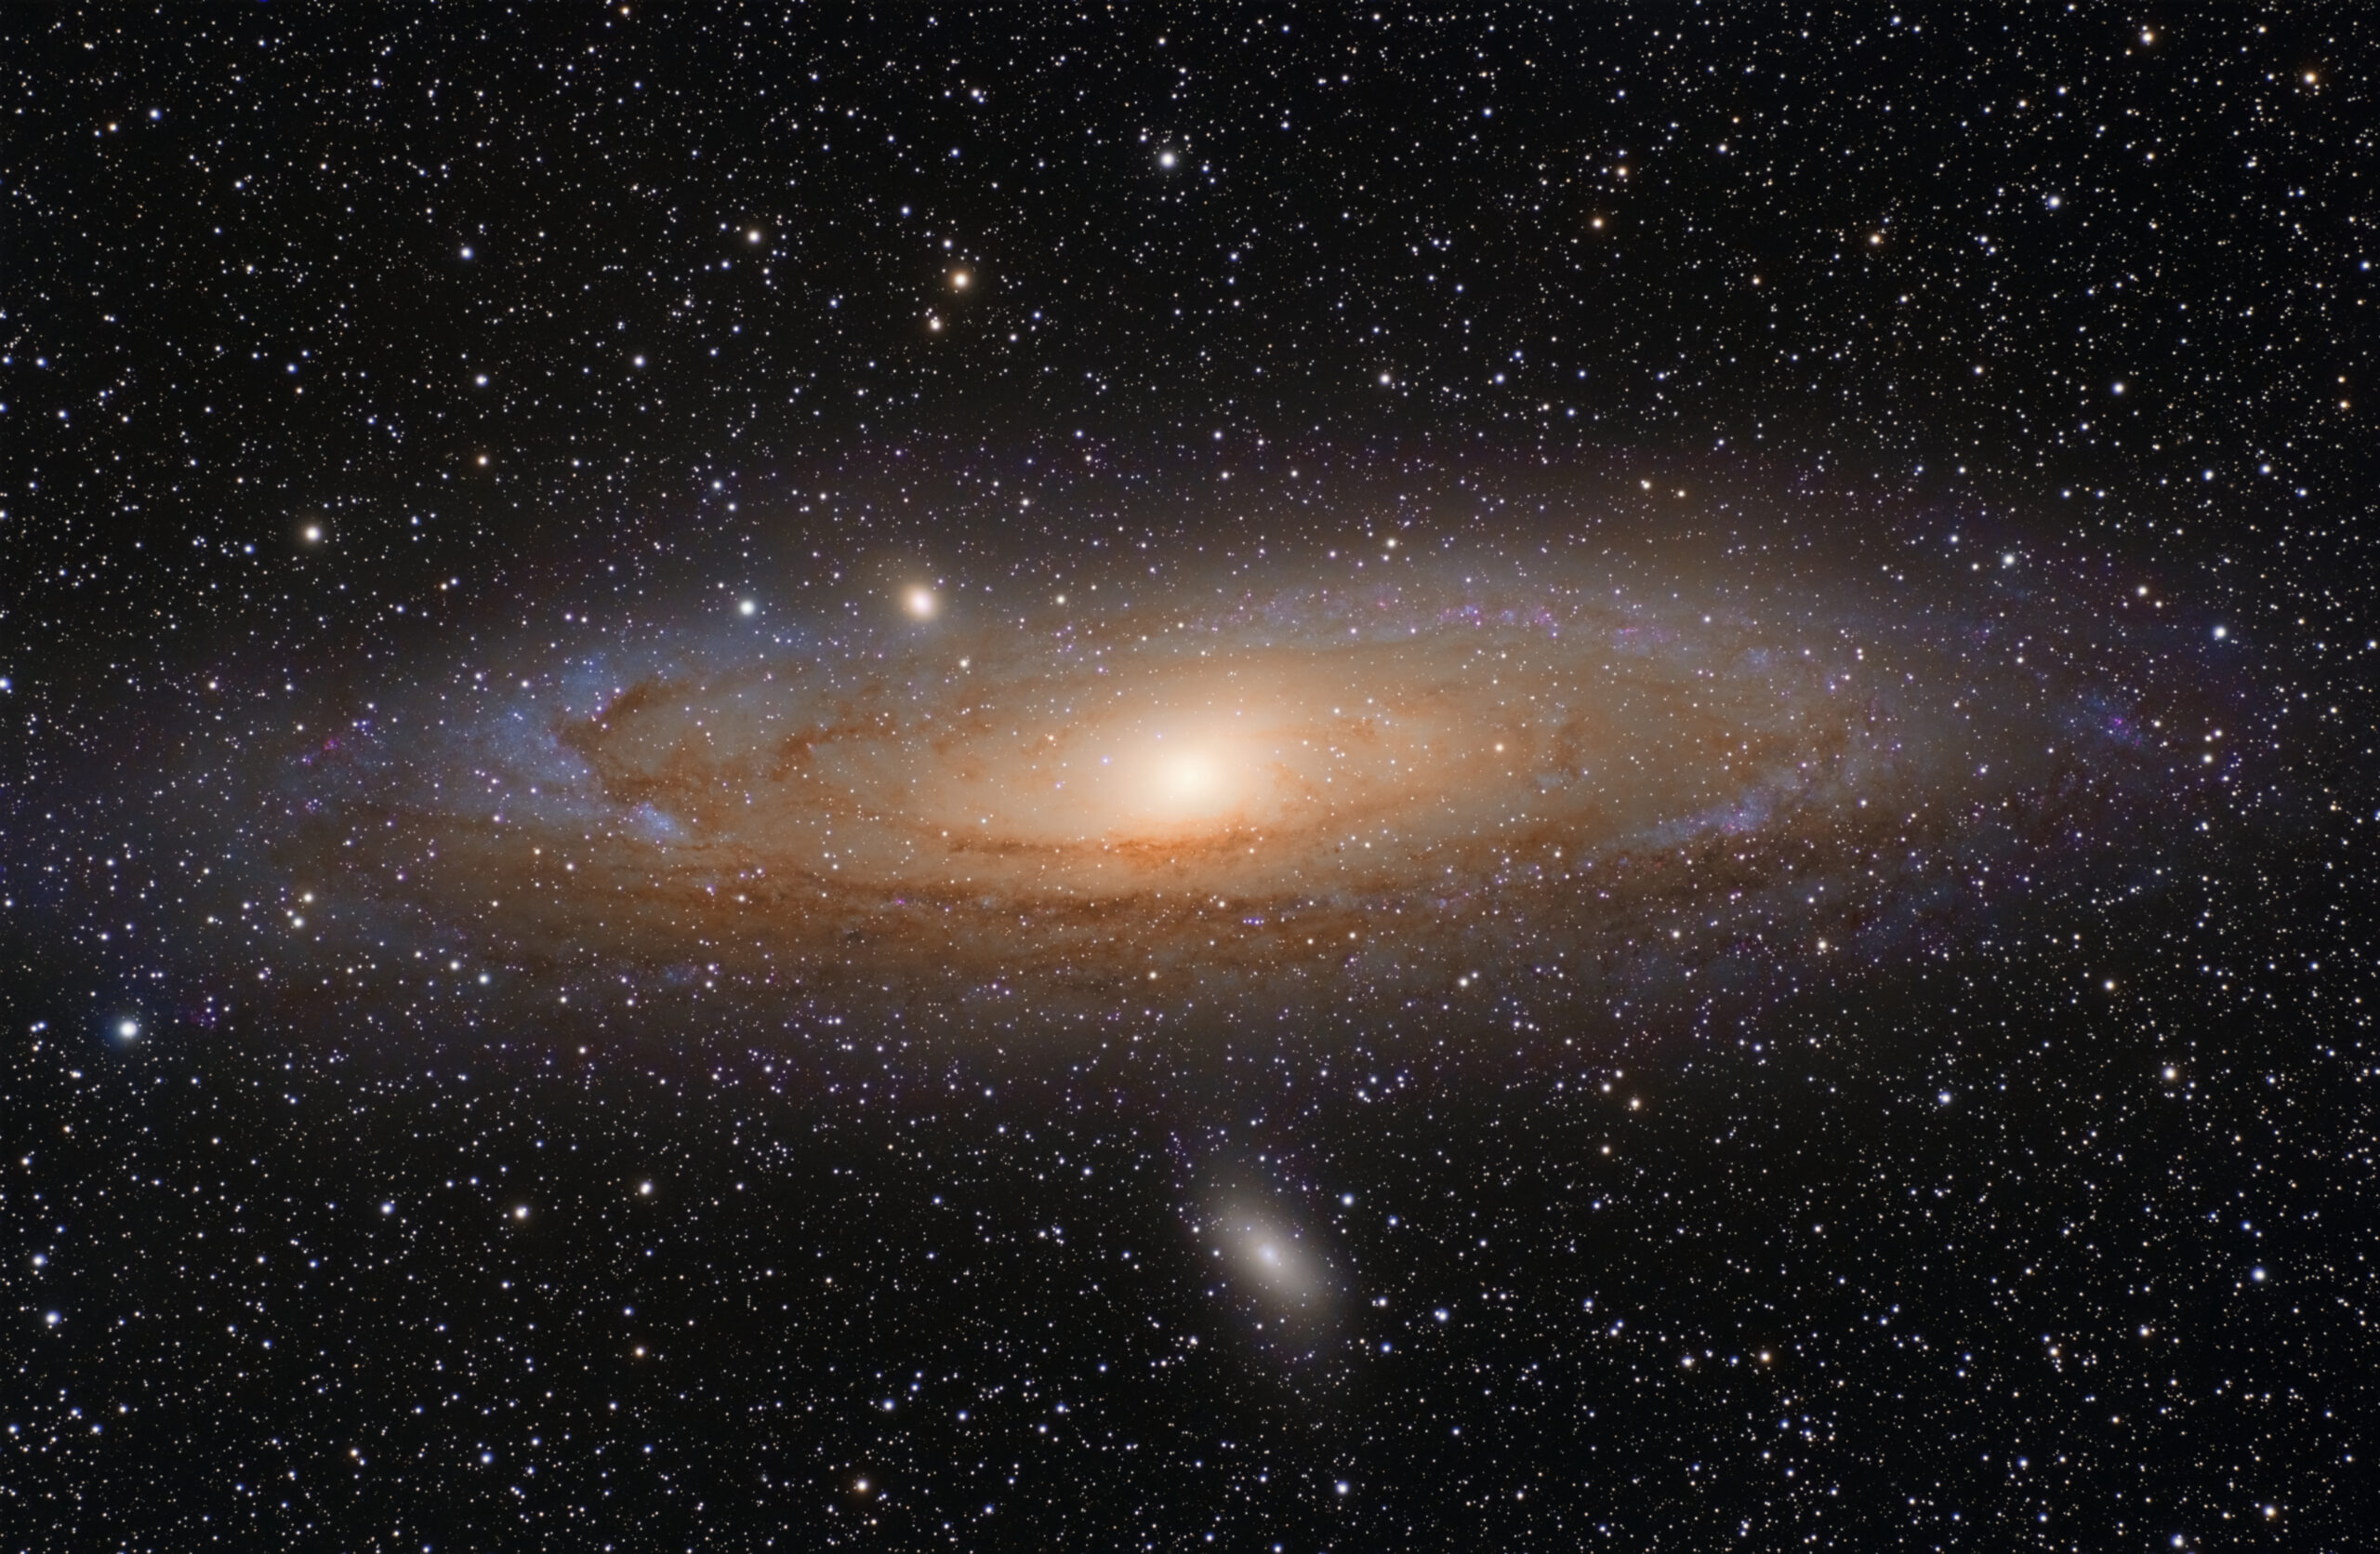
Astronomers in the early 20th century were locked in a fierce debate on the nature of the universe. One camp, led by Harlow Shapley, posited that recently discovered “spiral nebulae” were just small objects near the outer edge of the Milky Way. In this view, our galaxy filled nearly the entire observed universe. Shapley’s opponent, Heber Curtis, instead claimed that these sources (including the “Andromeda Nebula”, Figure 1) were in fact whole other “island universes”. While Curtis got some details wrong, the latter theory was eventually proven correct when Edwin Hubble estimated the distance to the Andromeda Galaxy and found that it was astonishingly far away – so far that its luminosity must be comparable to the Milky Way to appear as bright as it does in our night sky.
The idea that there are massive collections of stars, located at vast distances and with a size equal to or greater than the Milky Way, revolutionized astronomy. A new sub-field, “extragalactic astronomy”, was born. We are currently in the midst of a golden age in this field. Using cutting-edge observatories like the James Webb Space Telescope, astronomers are uncovering how the first galaxies formed and in what ways they have evolved throughout the life of the universe.
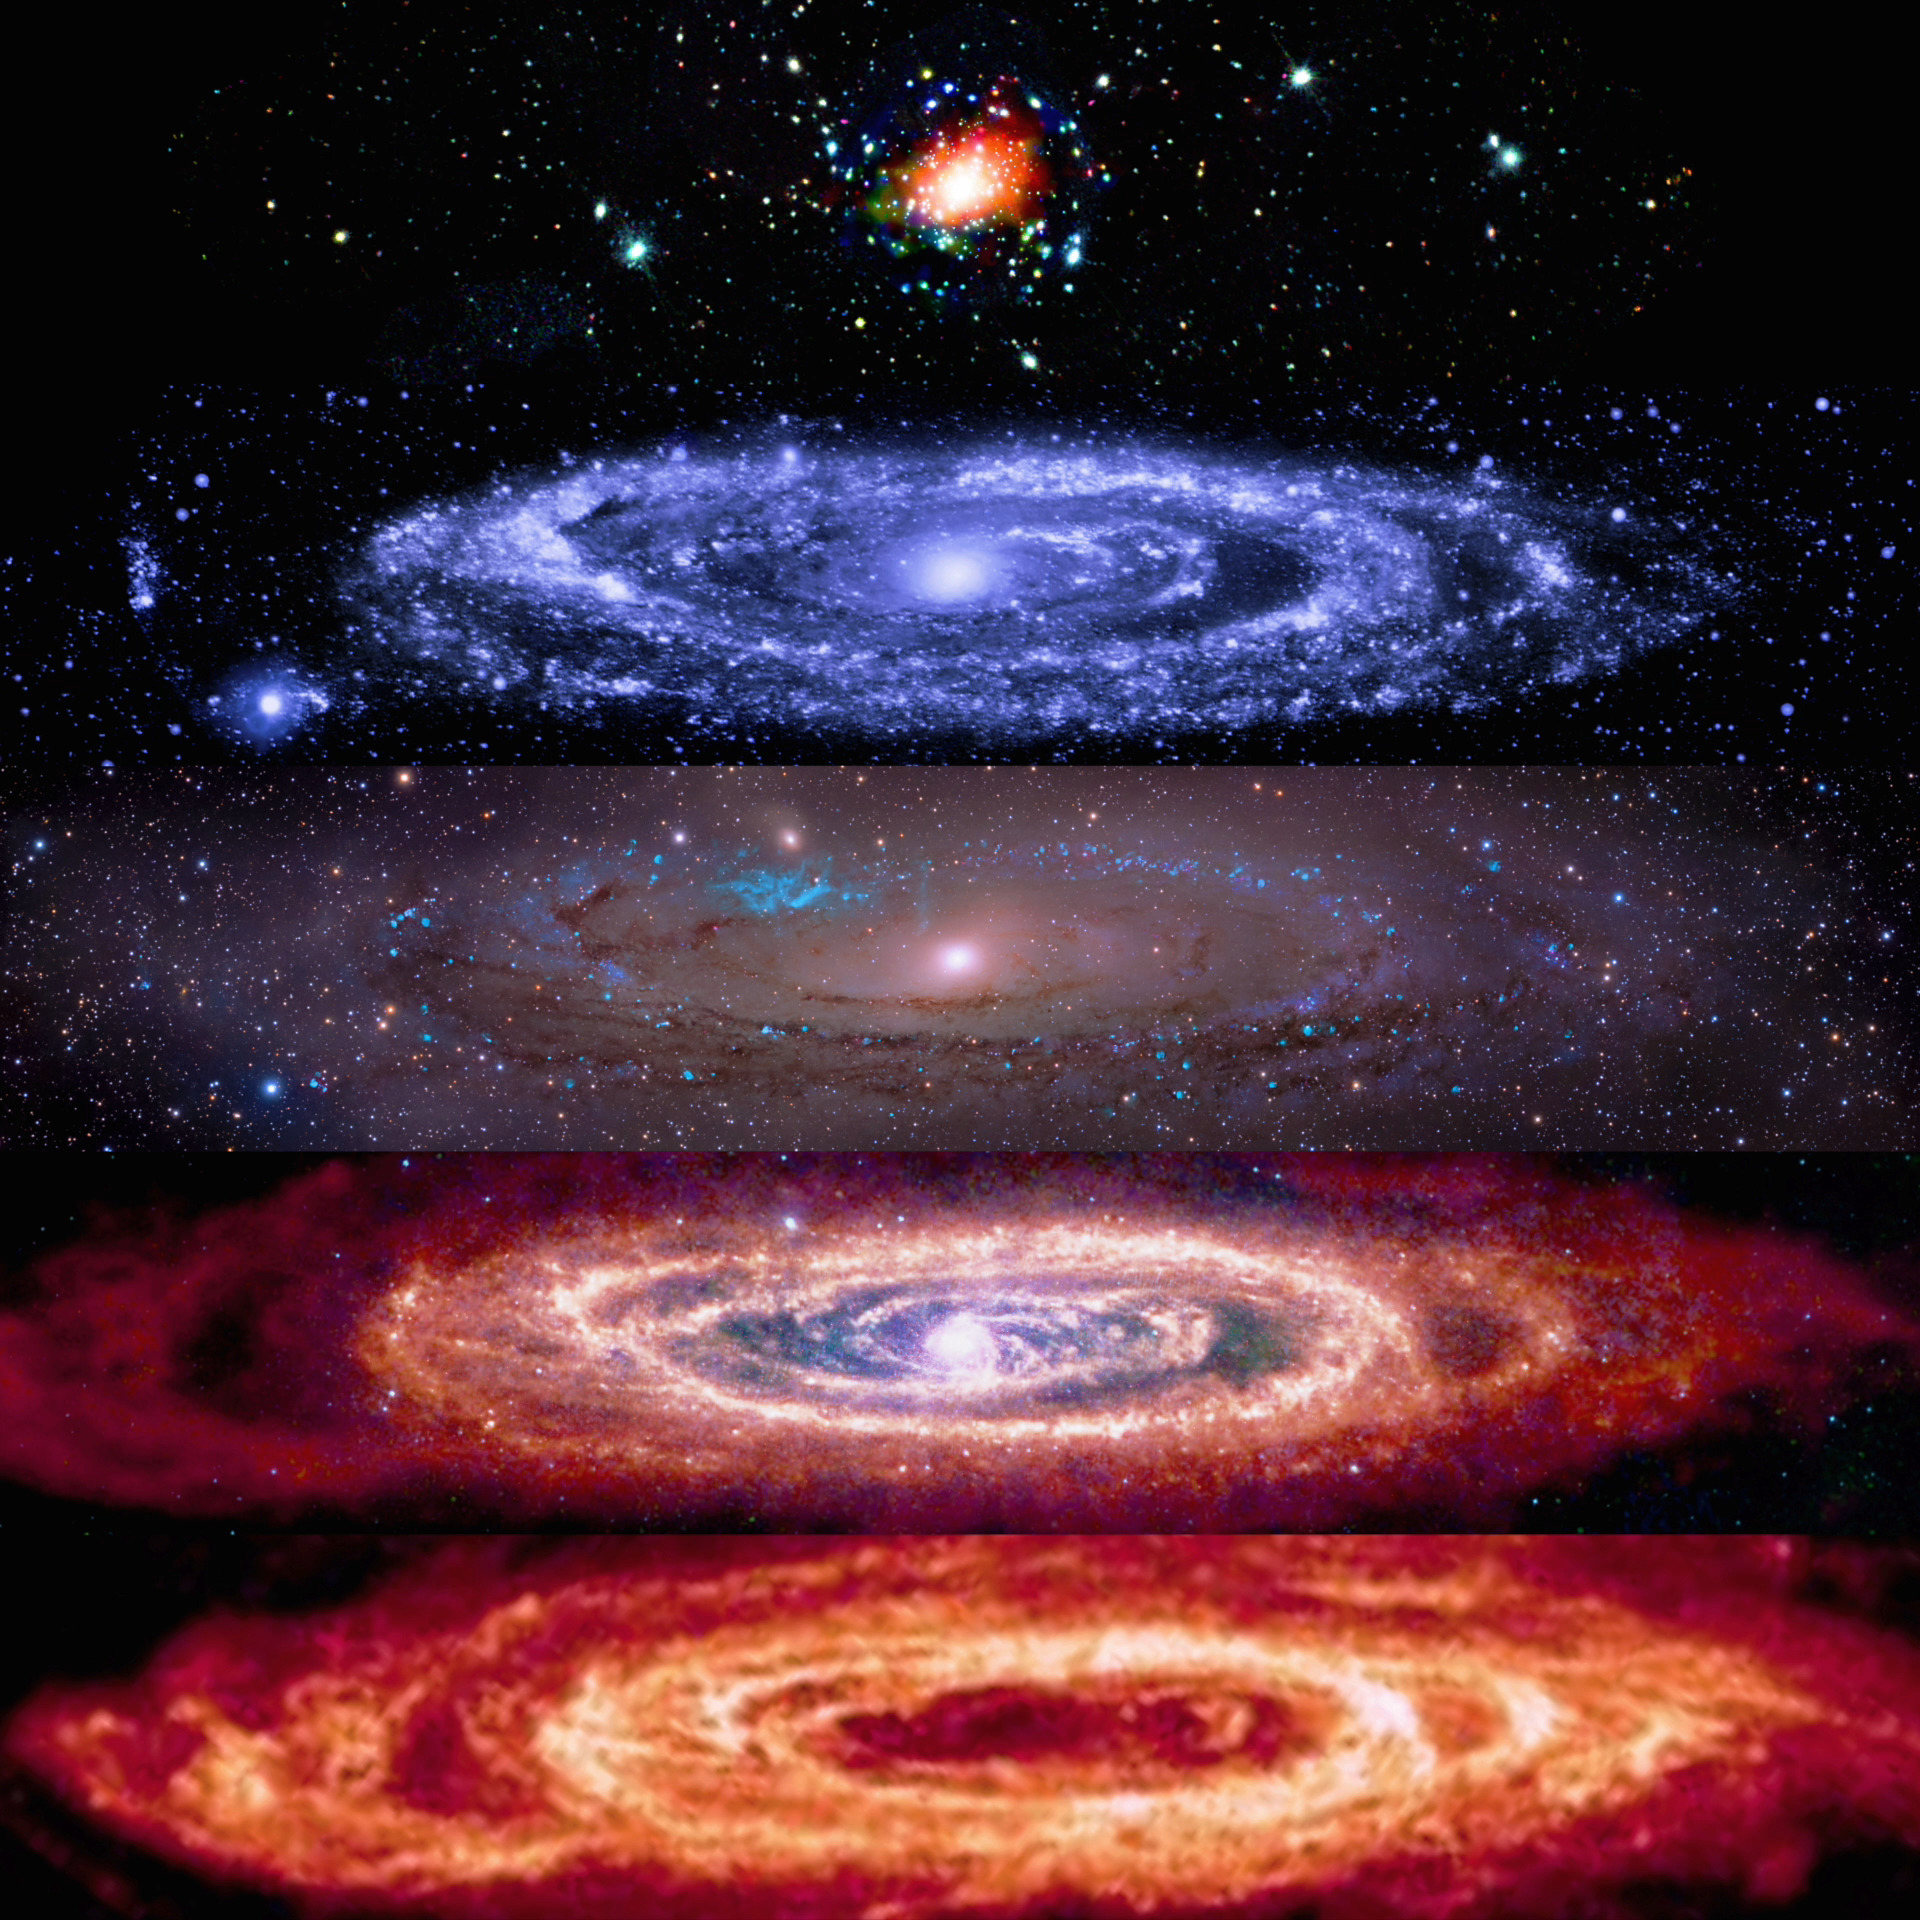
It might seem impossible to learn many details about distant galaxies, especially when the most distant appear as mere specks in our images. We can’t exactly pull pieces of them into a lab and put them under a microscope – all we receive from them is ancient light. Luckily, a stream of photons turns out to be a rich source of information. By measuring the amount of light emitted by a source at different wavelengths, astronomers construct a so-called “spectral energy distribution” (SED, Figure 2). These data hold the key to unlocking the properties of galaxies across cosmic time. In order to interpret them, we often reach for a powerful tool called “SED fitting”.
How to Bake a Galaxy from Scratch
The key idea behind SED fitting is to craft a theoretical model of a galaxy that is a close match to one we actually observe. If we can produce an artificial SED that’s a “good fit” to the real one, we can look at the parameters used to build the model and be reasonably confident that they reflect the properties of the real source.
We can do this because the light from galaxies is usually dominated by stars, and we have a very good understanding of what stars look like. That’s not to say that all stars appear the same: for example, a massive and hot supergiant star might be extremely luminous and emit most of its light at blue wavelengths, while a cool star on the main sequence will be faint and have output dominated by red light. However, all stars of the same type look essentially alike. So if we can figure out the exact right combination of different kinds of stars that add together to exactly match the SED of a galaxy, then we will know exactly what it’s made of. We can deduce many of the key properties of the galaxy from there, including its total mass, age, and composition.
There’s just one problem – there are nearly uncountably many ways to put billions of individual stars together to form a galaxy. While astronomers are no strangers to working with big data, this would be a nearly impossible task. Instead, we leverage insights from our knowledge of how stars form and evolve to simplify the problem.
One key fact is that stars have an upper and lower limit to how heavy they can be, and the number of stars that form with a given mass is not arbitrary. If you measure the masses of stars born from a cloud of gas, they always seem to follow the same distribution, called an “initial mass function” (IMF). This is quite astonishing when you think about it! No matter what kind of conditions surround a cohort of newly-born stars, there will always be many low-mass stars and few high-mass ones (Figure 3).
The fact that the IMF seems to be universal is extremely important, because the mass of a star essentially determines the course of its entire life. High-mass stars will be hot and bright but burn out quickly, whereas low-mass stars will be cool and faint, surviving for tens of billions of years or more. Putting this all together, we can achieve a truly stunning feat. Since we know the universal IMF, how stars evolve, and what they look like at each stage of life, we can predict exactly what the SED of any set of stars with the same age – a “simple stellar population” (SSP) – will look like. The chemical makeup of a star also impacts its appearance, so the composition of all stars in an SSP is assumed to be the same.
If each galaxy was just a collection of stars all born at the same time, we could match its SED perfectly by making a model of an SSP with the same age and chemical composition. In reality, we expect every galaxy (including our Milky Way) to be made up of stars born at a variety of times in the past. Thus, we arrive at the core of SED fitting. This technique attempts to combine multiple SSPs to match the SED of an observed galaxy, simulating what it would look like if multiple batches of stars formed over different times (Figure 4). Once we have found a combination of SSPs that reproduces our observations, we can reconstruct the detailed history of star formation in the galaxy.
The application of this technique took an agonizingly long time to catch on, but it has yielded incredible results. Using it, we can study in detail the properties of the very first galaxies, learn how their chemical composition has changed over time, and track the formation of stars over the course of billions of years. One only has to skim a handful of the most recent research papers published in extragalactic astronomy at any given time (or peruse the corresponding category on Astrobites) to understand how widely-applicable and influential this technique is.
Into the Weeds of SEDs
Beyond the core idea of putting together multiple SSPs, there are a few extra details which must be accounted for in SED fitting. These are often responsible for the subtle differences between various SED fitting codes, of which there are many. New SED fitting tools are still being minted to this day!
One major consideration is that stars born at different times in a galaxy are not isolated from each other. When a massive star dies, it explodes as a supernova and spews a maelstrom of elements into its surroundings, enriching nearby clouds of gas with higher-mass atoms and impacting the fates of future stars. Moreover, extremely fine particles distributed throughout every galaxy (astronomical dust) scatter and absorb light, modifying the observed SED. Dust generally causes galaxies to appear redder by preferentially removing blue light, but the exact way it does this depends on its quantity and composition. Moreover, the infrared part of the electromagnetic spectrum is often dominated by emission from this dust. These effects can be quite significant, so all modern SED fitting codes account for the impacts of both supernovae and dust.
Some state-of-the-art SED fitting programs also attempt to model light produced by sources other than stars, including active galactic nuclei. More recently, astronomers have experimented with machine learning techniques to characterize galaxy SEDs with a fraction of the computational effort. And there are ongoing debates about what kind of observational data (imaging or spectroscopy) is best-suited to be used with these codes.
Overall, we still have a lot to learn about the best ways to use and interpret the results of SED fitting, and future work will almost certainly lead to major refinements and improvements. Nonetheless, this technique has produced some of the most breathtaking discoveries in all of astronomy, and it will continue to be one of our most powerful tools to explore our universe.
Astrobite edited by Chloe Klare
Featured image credit: NASA, ESA, CSA, STScI
Image credits for Figure 2: X-ray: NASA/CXO/UMass/Z. Li & Q.D. Wang, ESA/XMM-Newton; Infrared: NASA/JPL-Caltech/WISE, Spitzer, NASA/JPL-Caltech/K. Gordon (U. Az), ESA/Herschel, ESA/Planck, NASA/IRAS, NASA/COBE; Radio: NSF/GBT/WSRT/IRAM/C. Clark (STScI); Ultraviolet: NASA/JPL-Caltech/GALEX; Optical: Andromeda, Unexpected © Marcel Drechsler, Xavier Strottner, Yann Sainty & J. Sahner, T. Kottary.