Paper Title: An Observational Correlation between Stellar Brightness Variations and Surface Gravity
Authors: Fabienne Bastien, Keivan Stassun, Gibor Basri, Joshua Pepper
First Author’s Institution: Vanderbilt University, Nashville, TN
To say that the Kepler Space Observatory has augmented our understanding of planets and the stars they orbit is like saying that the Internet has improved our ability to communicate. Kepler has discovered thousands of planet candidates, hundreds of planets, and opened our eyes to the fact that most planetary systems are not at all like our own solar system. Kepler has improved our understanding of variable stars, contributed to a more accurate distance estimator, and given us precise measurements of stellar properties through asteroseismology. And despite the recent failure of two of its reaction wheels preventing the continuation of its primary mission to find transiting exoplanets, Kepler continues to deliver incredible science. Today’s paper demonstrates yet another discovery: that the brightness variations of a star can be used to measure its surface gravity.
The Gravity of the Matter
Surface gravity is one of the fundamental parameters of a star. With access to surface gravity and effective temperature (the temperature at the photosphere), one can determine key properties such as mass and radius. Effective temperature is relatively easy to measure – all that’s needed are observations in at least two different broadband filters. Surface gravity, however, is more elusive. It can be determined to about 25-50% precision through spectroscopy, but this requires diluting a star’s light through a spectrograph, meaning the technique is only applicable to relatively bright stars. Asteroseismology, the measurement of stellar oscillations, is even more precise – only about 2% uncertain – but also requires the ability to distinguish minute flux variations, and so only the very brightest stars can be studied. This means that while we know the temperatures of a huge number of stars fairly accurately, we only have good measures of surface gravities for a tiny subset.
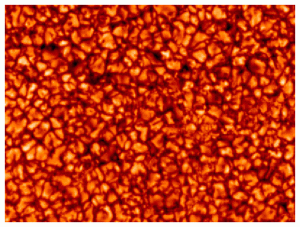
Figure 1: Granulation on the surface of the Sun. Each “cell” is up to thousands of km across. Granulation cannot be directly seen on other stars, but shows up as variations in brightness.
Is there a more easily measured property that might correlate with surface gravity, and thus be applicable to a larger sample of stars? Bastien et al.’s affirmative answer relies on the fact that stars similar to or smaller than our Sun transport energy in much of their interiors via convection. Pockets of hot gas are buoyed towards the surface, where the gas then cools and sinks. These cyclic convective motions lead to two important phenomena: granulation, a speckled appearance on the surface of a star (Figure 1), and stellar oscillations. Both lead to variations in brightness. It turns out that surface gravity has an important effect on stellar oscillations: the higher the gravity, the faster the rate of oscillations (this is why asteroseismology is able to measure gravity). Since both oscillations and granulation have their root in convection, perhaps we can learn about surface gravity by measuring the brightness variations associated with granulation?
Enter Kepler
In order to detect the tiny decrease in brightness from an Earth-sized transiting exoplanet, Kepler was optimized for high-precision photometry – up to a few parts per million change in a star’s light curve. It is thus relatively easy for Kepler to detect the “mere” parts per thousand variations that are a result of granulation. It is more difficult, however, to disentangle these variations from the myriad other effects that can cause changes in flux, such as rotation and magnetic fields. Bastien et al. tackle this problem using three variables that characterize brightness variations in a novel way that isolates the role of surface gravity (Figure 2).
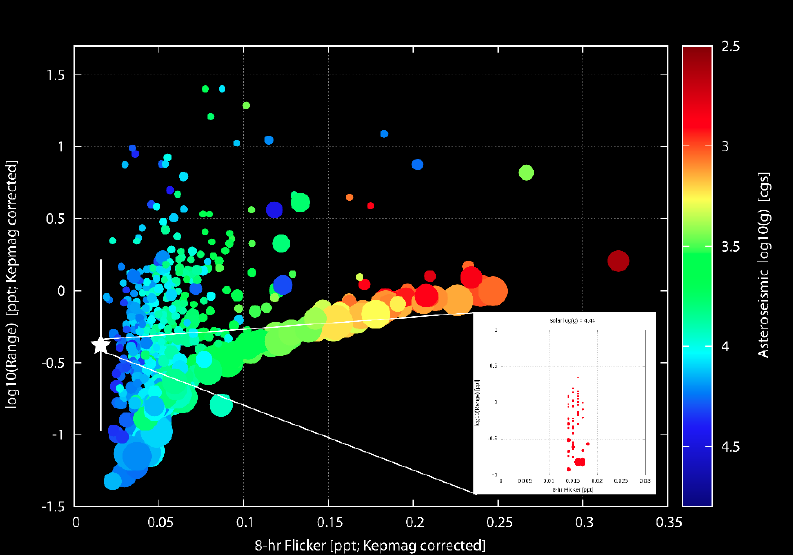
Figure 2: Brightness variations of Kepler stars with asteroseismically-determined surface gravities. The x-axis shows “F8”, the brightness variation over granulation timescales. The y-axis is “range”, the amplitude of variations. The symbol size shows “X0”, what timescale variations are the most important (high X0 means shorter timescale variations, such as granulation, dominate). For low range stars, F8 correlates well with surface gravity (color scale). The star symbol and inset plot show the Sun’s brightness fluctuation throughout the solar cycle. Note that its F8 (and surface gravity) change very little throughout the cycle.
- Range represents the difference between maximum and minimum brightness. Younger, more active stars have larger ranges because they have bigger and more sunspots that rotate in and out of view.
- X0, “number of zero crossings”, measures the approximate rate at which variations occur. High X0 values occur when fast changes dominate (such as those due to granulation).
- F8, “8-hour flicker”, is the statistic that measures the variation in brightness on granulation timescales of several hours.
The stars in this figure have asteroseismically-determined surface gravities, as shown by the color scale. Aside from stars with high “range” values, F8 correlates well with surface gravity. The authors fit this relation with a polynomial and then use it to estimate surface gravities for 1000 Kepler stars (Figure 3). The scatter about the relation gives the uncertainty in the predicted surface gravity – only about 25%, as good as the spectroscopic method, but applicable to many more stars!
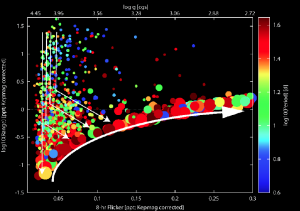
Figure 3: Surface gravity (top y-axis) for a larger sample of Kepler stars, determined using the F8 correlation shown in Figure 2. The color scale shows that most of the stars along the sequence shown by the large white arrow are slow rotators (and thus older).
The Upshot
With more accurately determined surface gravities, we will now know much more about not just these stars, but about the planets that orbit many of them. Planet properties (mass, radius) are directly tied to stellar properties, and so knowing a host star’s surface gravity might allow us to distinguish between an Earth-sized and a Neptune-sized planet orbiting it, for example.
Beyond its direct contribution, one of the most exciting aspects of this research is that Bastien et al. discovered this correlation almost by accident. They were exploring the Kepler database using Filtergraph, an online data visualization tool, to compare various observable quantities. Good data goes a long way, but a good way to look at it is just as important. And it is also clear that Kepler is far from done revolutionizing our understanding of astronomy.


Trackbacks/Pingbacks