Paper: Common 0.1 bar Tropopause in Thick Atmospheres Set by Pressure-Dependent Infrared Transparency
Authors: T.D. Robinson and D.C. Catling
First Author’s Institution: NASA Ames Research Center, Moffett Field, CA
Paper Status: Accepted to Nature Geoscience
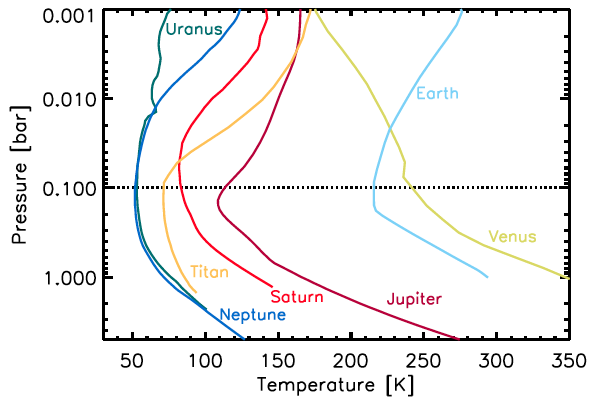
Figure 1: Atmospheric temperature profiles for solar system bodies with thick atmospheres. Each object’s temperature reaches a minimum at a pressure of about 0.1 bar (note: Venus deviates from this basic picture globally, but still shows a local minimum near 0.1 bar).
What do a number of planetary bodies, including Earth, Jupiter, Saturn, Saturn’s moon Titan, and potentially countless exoplanets all have in common? Each of their atmospheres has a characteristic structure in which the temperature reaches a minimum (called the tropopause) just when the pressure is at approximately 0.1 bar (one bar is about the atmospheric pressure at Earth’s surface). Figure 1 shows this common atmospheric structure for several Solar System bodies. Despite the incredible diversity in size, composition, and distance from the Sun, this temperature minimum is present in each of them. What physical processes cause this? An elegant new model explains this universal temperature minimum in terms of a few basic laws of physics.
Atmospheres 101
Figure 2: Schematic diagram of the Earth’s atmosphere. The troposphere and stratosphere are the bottom two layers, and are separated by the tropopause. The red line shows the temperature profile, which reaches a local minimum at the tropopause.
Let’s hit the (tropo)pause button for a moment and get some terminology in order. To understand the common structure of thick atmospheres, we turn to the best-studied example: Earth. Our atmosphere consists of several distinct layers, as shown in Figure 2 (see this link for much more detail). First, the troposphere begins just above the surface and extends up to about 8-15 km. The majority of the atmosphere’s mass, water vapor content, and the convection and turbulence that lead to most weather phenomena occur in this layer. Pressure and temperature both decrease with increasing altitude in the troposphere (it’s colder and the air is thinner at the summit of a 4000m mountain than at sea level).
Above the troposphere is the stratosphere, which extends to about 50 km above the surface. Pressure continues to decrease with altitude, but here the temperature structure is inverted: the higher regions are hotter than the lower ones. Heating is due to direct absorption of ultraviolet (UV) radiation from the Sun; since most of this occurs in the uppermost layers, there is progressively less and less UV radiation penetrating to lower layers, and thus progressively less heating. The boundary between these two layers, and the location of the temperature minimum, is the tropopause. Above the stratosphere are additional layers, but these aren’t included in the model so we won’t discuss them further here. Note that the model presented in this paper is applicable only to atmospheres with shortwave (UV and/or visible) absorbers in their atmospheres (such as Earth and the other bodies mentioned in the introduction) — otherwise the temperature inversion would not occur.
The Model

Figure 3: Schematic of the Robinson & Catling model. ptp is the pressure at the tropopause (the temperature minimum), which they find is always about 0.1 bar. The radiative-convective boundary separates the region above where radiative heating (from the Sun) dominates from the region below where convective heating is more important. p0 is the pressure at the surface (or for gas planets, the layer where the infrared optical depth becomes large).
Robinson and Catling’s model uses just a few basic physical relations to explain the common 0.1 bar pressure at the tropopause and is able to successfully match the atmospheric properties of a number of solar system bodies. Although the full equations are relatively complex, the basic idea is straightforward. Figure 3 shows their results schematically. First, they use a relation between temperature and infrared optical depth — the level to which infrared radiation is absorbed by air molecules — they developed in a previous paper. They then use the basic calculus trick of taking the derivative and setting the result equal to zero to solve for the optical depth at which the temperature is at a minimum. This is the optical depth at the tropopause. Finally, they combine the following two physical relations to convert optical depth into pressure:
- infrared optical depth decreases with altitude, i.e. absorption (and thus heating) occurs more strongly at lower altitudes in the troposphere. This is a direct result of optical depth decreasing with decreasing density (fewer molecules means less absorption).
- hydrostatic equilibrium, i.e. the change in pressure with elevation balances the weight of the air due to gravity
These two relations can be combined to show that infrared optical depth decreases with decreasing pressure as a power law with exponent 2. Thus given the optical depth at the tropopause (computed in the steps described at the top of this section), the model solves for the pressure at the tropopause. Remarkably, the model gives a consistent answer: the tropopause occurs at about 0.1 bar, regardless of the planet’s other properties.
A Tool for Exoplanetary Exploration
Beyond the fact that this model seems to provide an explanation for the temperature minima observed in the atmospheres of solar system bodies, it might also be used to gain valuable information about systems that are much less well characterized: exoplanets. One potential application is the assessment of an exoplanet’s habitability. If habitability is defined to mean the presence of liquid water on the planet, then measurements of both the surface pressure and surface temperature are required. Robinson and Catling’s model solves for either one of these parameters given the other, cutting in half the number of measured quantities needed. So it may be possible to infer the presence (or absence) of liquid water on a planet’s surface by, for example, using transmission spectroscopy to estimate the surface temperature, then using the model to solve for the surface pressure.
Author
Thanks for for taking the time to write a nice summary about this paper that I co-authored.
One little point I would add: For the “0.1 bar rule” for a tropopause minimum to apply, a planetary atmosphere needs to have shortwave absorbers in its stratosphere so that there’s actually a minimum in the temperature versus pressure profile at the base of the stratosphere. If there’s no minimum, our rule for a minimum ceases to apply! On Earth, stratospheric temperature increases with altitude (a so-called “temperature inversion”) because ozone absorbs ultraviolet sunlight. On the giant planets and Titan, a stratospheric temperature inversion is caused by solar absorption in the visible & near-infrared methane bands as well as absorption by stratospheric hazes.
A hypothetical exoplanet with a purely CO2-N2 atmosphere, for example, would have no tropopause temperature minimum and hence the ‘0.1 bar’ rule for a minimum would not apply. The paper argues that many exoplanet atmospheres are likely to have stratospheric inversions, but one has to bear in mind that some exoplanet atmospheres may not. Just a caveat–that’s all !
-Sincerely, David Catling
Dear David,
Thank you for the clarification. I could not find the right words to eloquently provide that important caveat and thus wrongfully left it out of the original article. I appreciate you summarizing it so nicely.
Best,
Chris