Title: Using Deep Space Climate Observatory Measurements to Study the Earth as An Exoplanet
Authors: Jonathan H. Jiang, Albert J. Zhai, Jay Herman, Chengxing Zhai, Renyu Hu, Hui Su, Vijay Natraj, Jiazheng Li, Feng Xu, Yuk L.Yung
First Author’s Institution: Jet Propulsion Laboratory, California Institute of Technology, Pasadena, California
Status: Submitted to ApJ, open access on arXiv
The search for habitable, Earth-like planets is high on the agenda of exoplanetary scientists. However, habitability is far more complicated than checking that a planet sits within the goldilocks zone of not-too-hot, not-too-cold temperatures, just right for liquid water to exist on its surface. Dozens of other factors, such as the planet’s atmosphere, seasons and surface geography, are of critical importance to sustaining a watery planet and creating somewhere suitable for life.
Many previous astrobites have covered studies investigating exoplanetary atmospheres via transmission spectroscopy, but today’s paper takes a slightly different angle by considering the possibilities of direct imaging. Using our own habitable Earth as a “proxy exoplanet”, the authors inspect multi-wavelength observations from the Deep Space Climate Observatory, or DSCOVR, to figure out what we should be looking for further from home.
DSCOVR is largely used for space weather monitoring, but its Earth-facing instrument EPIC, the Earth Polychromatic Imaging Camera, takes pictures of the sunny side of our planet from Lagrange 1 in ten wavelengths, from the ultraviolet to near-infrared (if it’s not already in your twitter feed, check out the DSCOVR:EPIC bot for a daily dose of pale blue dot).
01:09 on Tuesday May 29th, over the North Pacific Ocean pic.twitter.com/uLxJJjN5L2
— DSCOVR:EPIC (@dscovr_epic) May 30, 2018
Observing the Earth as an exoplanet is not a new idea – but DSCOVR has an advantage over many other Earth-observing missions in that the data span a long period of time. The authors analyse over two years’ worth of data from EPIC. By looking at how these images change with time, on periods from hours to years, they work out the kind of imaging we would need of distant exoplanets in order to deduce their rotation periods, seasonal changes, weather, and surface type.
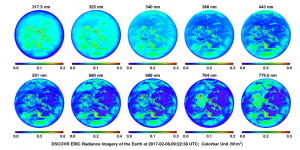
Figure 1: EPIC images of the Earth in 10 different wavelengths. Cloud cover is bright in every wavelength, and continents are brighter in the longest wavelengths: Africa stands out at 779.5 nm. Figure 2 in the paper.
There are a number of things to be learned from these multi-wavelength images (figure 1). The reflectance of different surface types varies with wavelength: the ocean, for example, reflects most in the blue-green wavelengths, and vegetation reflects strongly in the near-infrared. So by analysing differences in reflection between long and short wavelengths, it may be possible to identify different types of surface coverage on exoplanets. Clouds reflect light across the spectrum, and the authors go on to separate cloud cover by simply subtracting the emission in a wavelength where there is little reflectance from other components from the other images.
An obvious difference between EPIC images and potential direct imaging of exoplanets is the glorious resolution: each EPIC pixel images a 12×12 km region of the Earth’s surface, compared to the unresolved point source we would detect if we were to place the Earth around our nearest neighboring star, Alpha Centauri. To simulate exoplanet imaging, the authors average their data into one pixel, and then look at the time evolution of the signals in each wavelength.
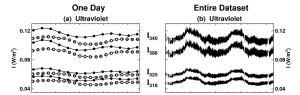
Figure 2: Time-series data for the “single-point” measurements. On the left are the measurements over the course of a single day (filled circles show February 8th, 2017, and empty circles show August 8th, 2016). On the right is the entire dataset spanning over 800 days. Figure 4 in the paper.
Figure 2 shows those time variations. Peaks can be seen periodically, from features such as Pacific Ocean clouds reflecting on a daily cycle, and seasonal changes depending on the part of the Earth facing EPIC.
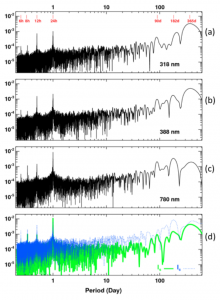
Figure 3: Periodograms, showing peaks at the periodic frequencies in the data: notably, the daily cycle at 24 hours, and the yearly at 365 days. (d) shows the signal split into the contribution from clouds, in blue, and from surface features in green. Figure 5 in the paper.
The authors investigate these periodic changes with a Fourier analysis. The periodograms in Figure 3 simply show peaks at the frequencies of periodic features in the data. There are some obvious ones: a peak at 24 hours, and at 365 days. These come from the daily patterns of cloud and continent passing through the images, and a combination of annual climate cycles such as monsoons as well as the tilt of the Earth. Some periodicities are less obvious: the peak at 12 hours is attributed to the Pacific and Atlantic oceans passing through the field of view 12 hours apart. The longer periodicities, at 90 and 180 days, are most likely due to DSCOVR’s orbital period, but may also show trends in the growth cycle of crops. By looking at the relative strengths of the peaks across different wavelengths, the features responsible for different cycles can be deduced to build up a picture of the surface composition of the planet.
Another difference between these images and exoplanetary imaging is the phase: EPIC’s view of the Earth is always of a fully sunlit planet. The authors simulate the effect of viewing an exoplanet orbit edge-on, as any exoplanets detected by the transit method would be, by putting artificial phases on the images (figure 4). They successfully recover the same features in the periodogram from these phased images. They also estimate the minimum amount of data required to detect the rotation period, showing that for the Earth, a measurement needs to be made at least every 9 hours.
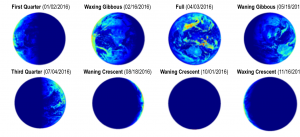
Figure 4: Artificially “phased” images, to simulate measurements of an exoplanet viewed with its orbit edge-on. Figure 6 in the paper.
In practice, directly imaging exoplanets is incredibly challenging, and has only been done on a handful of objects. While we might not be there yet, the techniques explored here could be used to guide future mission design for investigating exoplanet habitability, and open up new prospects for time-evolution, multi-wavelength studies of distant worlds.
Author