Following the data release, a slew of Kepler papers went up on astro-ph this evening. In my previous post, I went straight to the numbers, but here I’ll discuss the Kepler mission and data in some depth, which I think will generally be useful for understanding current and future Kepler results.
The figures I’ve included are from a Nature paper by Jack J. Lissauer (NASA Ames) that was the focus of the NASA press release. This multiplanet system with 6 new planets all orbiting a star labeled “Kepler-11.” (The planets are then labeled with letters, in this case b-g. The first planet found is called [starname]b and so on. In this case, all 6 planets were detected simultaneously so the authors have labeled them from inside to out, e.g. Kepler-11b is the innermost planet and Kepler-11g is the outermost.)
The planets ranging in size from 1.97 to 4.52 Earth-radii, which are believed to be coplanar to within ~1 degree. All but the outer most would be within Mercury’s 0.39 AU orbit, making it the most tightly packed planetary system discovered. That’s just the basics. It’s quite an interesting system and has been talked about a lot, so I’m just going to direct anyone interested to Phil Plait’s Bad Astronomy post about it.
- Title: Characteristics of planetary candidates observed by Kepler, II: Analysis of the first four months of data
- Author: William J. Borucki et al.
- First Author’s Institution: NASA Ames Research Center
The goal of the Kepler mission is to figure out how many Earth-analogs (similar size and climate) are out there. There are several ways to detect exoplanets, but Kepler uses the transit method: when a planet passes between us and its host star, it causes a dip (~1%) in the star’s observed brightness (flux). This dip has a characteristic inverted top-hat shape and the light curve can be used to determine the planet’s orbital period and radius. With radial velocity data, the planet’s mass and thus its density can be determined (the radial velocity method relies on observing Doppler shifts in the star’s spectra as it “wobbles;” the wobble is the result of the star orbiting around the star/planet center of mass.)
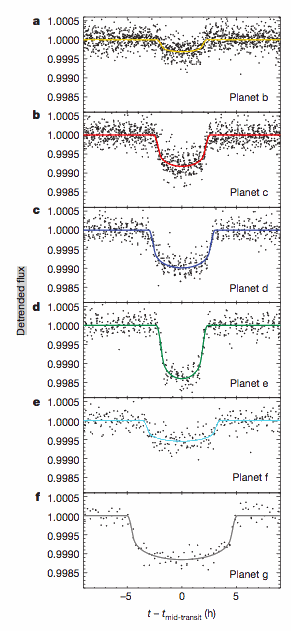
Unfortunately, the planetary system has to be in an opportune alignment for us to see a transit so we don’t expect to see transiting planets around most stars. To get around this, Kepler is monitoring ~150,000 stars similar to the Sun over a period of 3 years. For now, we’ll have to settle for the results based on the first four months of data. In the figure to the left, you can see examples of 6 different transit events, one for each of the Kepler 11 planets. These are plots of flux (normalized to the out-of-transit flux) against time.
One important aspect of this research is the identification of false positives: objects that display light curves consistent with a planetary transit but are in fact something else. False positives generally fall into two categories. The potential transit signature could just be noise in the data, or it could result from a different astrophysical event. Eclipsing binaries, variable stars or multi-star systems could be selected as potential transits by Kepler’s planet finding robot (which they refer to as the Transiting Planet Search pipeline). Nathan discussed the effect of stellar variability on exoplanet detection in a previous post. Tests and further observations are done to weed out these interlopers. The false positive rate in the Kepler candidate list could be as low as 5%, although uncertainties, such as what Kepler can easily identify as not being a transit signature, are a factor.
Below, I’ve included the Kepler 11 data. The top panel is the raw data and the bottom is with the trends removed. There are some gaps in the data, but you can see narrow dips that mark transits (the few points scattered about are noise); the transits of each planet are marked in differently-colored dots along the bottom. Of course, because we typically only detect 1 or 2 planets in a system rather than 6, there are usually there are far fewer dips. This might give you some idea as to the difficulty of validating transiting planets; note especially the scale on the flux!
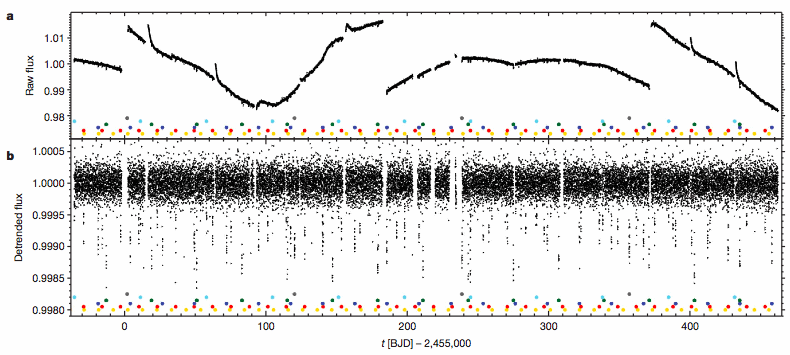
Raw (top) and detrended (bottom) light curve of the Kepler-11 system. Dips mark transit events; each transit is marked by a dot and each planet is labeled in a different color. Note what a small percentage of the total flux each dip is.
In addition to the possible false positives, there are several other problems with drawing statistical conclusions from the Kepler data set right now: the particular stars selected for study, noise and methods of analysis all bias the results and certain planets (large planets at small orbital radii passing in front of a dim star) are easier to detect than others. All of these effects on planet detectability need to be well-understood and included in the statistical analysis. The survey is also not complete: the faintest stars and smallest candidates especially need more data. Additionally, current study is restricted to those planets with periods less than 125 days (planets out there with longer periods will have only transited once or not at all!).
That’s not to say the results aren’t very interesting! As you may have read in my previous post, Kepler has now found 1,235 planet candidates. They range in size from about Earth-sized to larger than Jupiter. About half of these candidates are the size of Neptune, but 68 are similar in size to the Earth; the size distribution peaks at 2-3 Earth-radii and declines at larger sizes. Among them are more than 150 candidate multiple transiting planet systems. A variety of methods help to validate such candidates and constrain their orbits and masses. In turn, these can tell us about the formation and evolution of planetary systems, especially planet migration.

Actually, the planets are designated b, c, d, etc. The letter a is assumed to apply to the star itself. That’s why, for example, the first exoplanet discovered around a normal star is known as 51 Pegasi b, not a. And if you look at the Kepler-11 figures, you’ll see the planets labeled b through g, not a through f.
Quite right! The dangers of writing blog posts late at night…
An amateur’s question here. Does the amount of flux (the dip shown) indicate something specific like plant size or is that information inferred by other data like orbital rate?
Good question! The depth of the transit tells you the planet radius, because the amount of light blocked by the planet is proportional to the square of the planet’s radius. The duration of the transit gives you information about the planet’s orbital period, but you don’t necessarily know what the inclination or eccentricity of the orbit is.