- Paper title: Decoupling Phase Variations in Multi-Planet Systems
- Authors: Stephen R. Kane & Dawn M. Gelino
- First author’s affiliation: NASA Exoplanet Science Institute, Caltech
The Big Picture
One of the most exciting results of the Kepler mission is the discovery that multiplanet systems are common. Indeed, 20% of planet host stars harbor more than one planet candidate. Some planetary systems might not be perfectly aligned and the likelihood of transit decreases with increasing orbital separation, so even host stars with only one reported planet candidate could actually host additional non-transiting planets. For example, the authors point out that a distant observer searching for transiting planets orbiting the Sun would see a maximum of two transiting planets (Mars and Neptune). Even more likely, the observer would see only one transiting planet or no transiting planets at all. Given that there are actually eight planets in the Solar System, the fact that an alien astronomer would only observe one or two planets in transit is a nice reminder that the transiting systems observed by Kepler might also host additional non-transiting planets.
While planetary astronomers are excited about the prevalence of multiplanet systems, the presence of multiple planets complicates some studies. For instance, the astounding precision of Kepler light curves (brightness measurements) has allowed astronomers to study the tiny out-of-transit brightness variations caused by the presence of planets, but these effects are difficult to observe in multi-planet systems because the contributions from the other planets look like noise. In this paper, Kane and Gelino model the brightness variations induced by starlight reflecting off planets in multiplanet systems. Although the signature initially looks messy, Kane and Gelino find that they are able to use Fourier Analysis to recover the periods of some or all of the planets in a multiplanet system, but that the success of the method is highly dependent on the cadence (how often measurements are taken) and duration of the observations.
Generating Brightness Variations
Kane and Gelino conduct their study by considering the brightness variations caused by reflected light from multiple planets in theoretical systems, the Solar System, and in two Kepler systems. This astrobite focuses on the two theoretical systems, but check out sections 4 and 5 of the paper to learn about the applications to real multiplanet systems. In all cases, the authors calculate the expected variations by assuming an albedo (reflectivity) and eccentricity for the planets and computing the amount of light that would be reflected by the planet at each phase of its orbit. The amount of reflected light scales with the square of the planet radius, so a larger planet would appear brighter than a small planet assuming that the two planets had the same albedo.
The dependence of the amplitude of the brightness variation on planet radius is clearly illustrated in the plot below. The solid lines in the plot display the brightness variations due to each of the four planets in a theoretical system with three short-period Earth-size planets and one longer period Jupiter-size planet. The three solid lines at the bottom of the plot are the contributions of the three Earth-size planets to the brightness variations and the much larger, longer-period solid curve is the contribution from the Jupiter-size planet at 0.7 AU (astronomical units). The dotted curve displays the net brightness variation due to all four planets. As you can see, the overall shape of the curve matches that of the Jupiter-size planet, but there are many short period fluctuations due to the three close-in Earth-size planets. If we didn’t know that the model system contained four planets, we might assume that the short-period variations were correlated noise rather than attributing them to additional planets in the system.
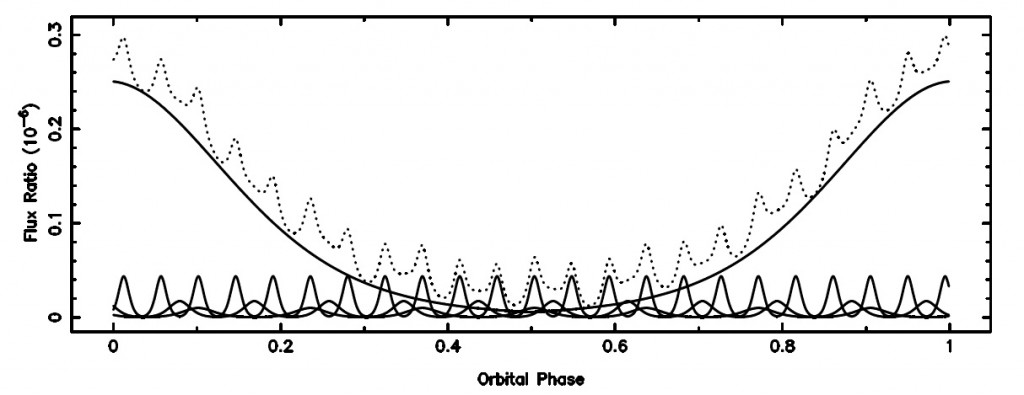
Contributions to the brightness variation from each planet (solid lines) and the total brightness variation (dotted line) in a theoretical multiplanet system with three short-period Earth-size planets and one longer-period Jupiter. Figure 1 from Kane & Gelino 2012.
Using Brightness Variations to Determine the Number of Planets in a System
After generating models of the expected brightness variations, Kane & Gelino attempt to use their modeled light curves to determine the number of planets in each system and the orbital periods of each planet. They first create a simulated data set by “measuring” the brightness of the system at a set of quasi-randomized times and then perform a Fourier Analysis of the phase curves to pick out periodic signatures in the brightness variations. The mock data set and resulting periodogram for a theoretical system with four Super-Earths are shown below. As indicated in the bottom panel of the figure, the Fourier Analysis successfully recovers the orbital periods of three of the planets, but underestimates the orbital period of the Super-Earth at 17 days. That planet is responsible for the lowest amplitude brightness variation, so it is not surprising that it is the most difficult planet to recover from the data set. For systems like this in which one signal has a much lower amplitude than the other signals, Kane & Gelino point out that it can be more effective to fit the highest amplitude signals (e.g., the planet at 10 days) first and then look for smaller signatures in the residuals.
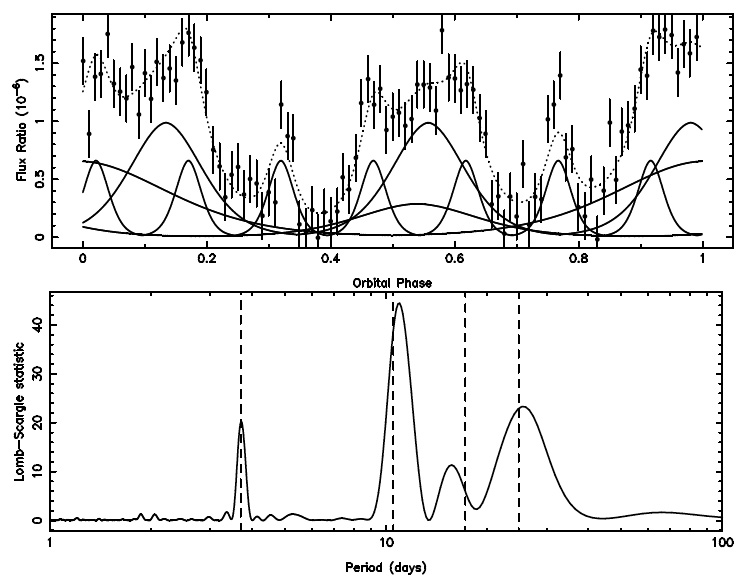
Top: Expected brightness variations in a theoretical multiplanet system with four short-period Super-Earths. The individual contributions from each planet are plotted as solid lines and the combined signature is shown as a dashed line. The data points with error bars indicate the mock data set used in the analysis. Bottom: The periodogram created by the Fourier Analysis of the mock data set. The dashed lines mark the true periods of each of the planets. Figure 2 from Kane & Gelino 2012.
Although disentangling the sources of various brightness variations will likely be more challenging in some real systems due to star spots, sparser data, and the presence of non-transiting planets, Kane & Gelino have demonstrated that Fourier Analysis can be used to identify the presence and orbital periods of at least some of the planets in multiple planet systems. As Kepler continues observing these fascinating multiple planet systems, the longer baseline of data and the improved eccentricity fits for known transiting planets will improve our ability to detect non-transiting planets from out-of-transit brightness variations.


Trackbacks/Pingbacks