Title: Keck Observations of the Galactic Center Source G2: Gas Cloud or Star?
Authors: Kim Phifer, T. Do, et al.
First Author’s Institution: Department of Physics and Astronomy, University of California, Los Angeles, CA
Look up in the sky! Is that a cloud or a star? This is exactly what one of our very own astrobites authors, Kim Phifer, is asking about for the galactic center source G2. Discovered just last year and discussed in this astrobite, G2 was originally thought to be a gas cloud with a mass of about 3 earth masses headed directly toward our galaxy’s central supermassive black hole, Sgr A*. However, G2 might be something quite different as previously suggested by this article in which the authors suggest that G2 might be a low-mass star with a strong stellar wind which produces a bow shock as it orbits the black hole. Another possibility is that G2 may be a star surrounded by a protoplanetary disk as discussed in this previous astrobite. The question that these authors aim to answer is: Is G2 a gas cloud or a star? In this article, the authors look at both spectral and imaging data to determine the orbital properties and spatial shape of G2 to determine the answer to this question.
In order to obtain the radial velocity and position of G2 the authors use the OSIRIS Integral Field Spectrograph (IFU) on the Keck-10m telescope, which provides information about the position and spectrum of an astronomical object, to measure the Hydrogen Br-γ emission line (i.e., the electronic transition from the n=5 to n=4 energy level of Hydrogen) of G2. By extracting the spectrum of G2, the authors are able to determine its radial velocity from the doppler shifted Br-γ emission line. The figure below shows the evolving spectra of G2 taken at four different epochs from June 18, 2006 to June 9, 2012. The Br-γ emission line is the peak to the right of the black dashed line at all epochs. The fact that the observed emission line is at a larger wavelength than its rest frame wavelength implies that G2 is moving away from us (i.e., redshifted). At the earliest epoch, the Br-γ line shows extended emission confirming that G2 is extended and exhibits a velocity gradient.
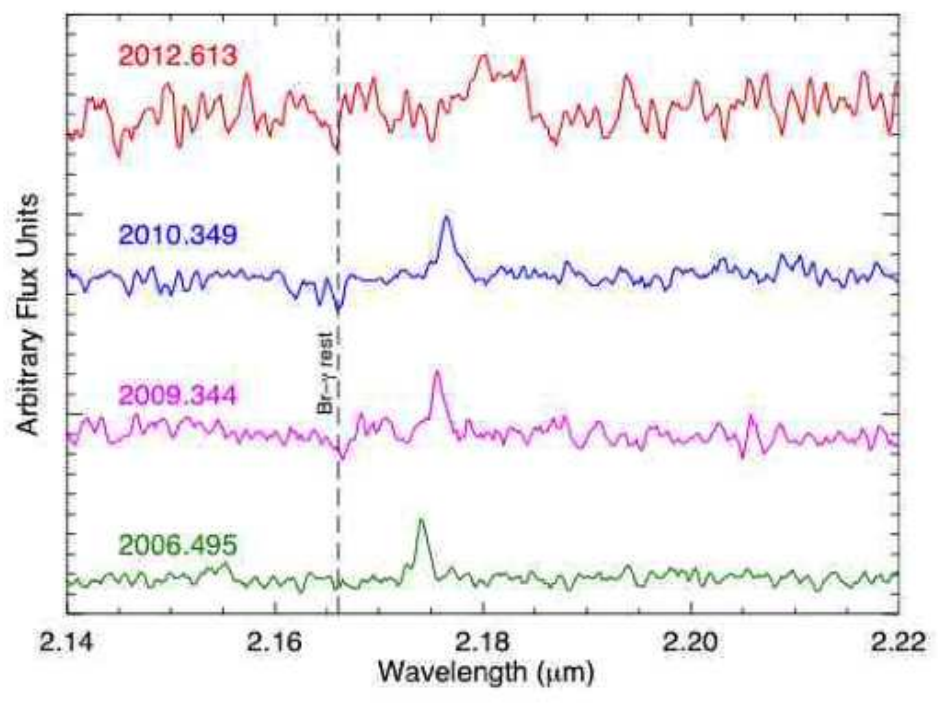
The evolving spectra of G2. The black dashed line denotes the rest wavelength of Br-γ. These spectra taken at four different epochs show the highly redshifted Br-γ emission line (largest peaked line). The redshift and broadening of the emission line provides the kinematic information of G2. The Br-γ line has been scaled such that it is the same height at all epochs.
They also take near-IR images of G2 with the NIRC2 imager on the Keck-10m telescope to confirm its position with respect to the OSIRIS data and to also derive the extended structure of G2. The NIRC2 images of G2 can be seen below. It is also interesting to note that they do not detect G2 in the K’ image. This result implies that if G2 is indeed a star then it is likely a low-mass star, or if it is more massive, then its light must be blocked by surrounding dust. From the OSIRIS and NIRC2 data, the authors model G2’s orbit around Sgr A*. To obtain G2’s orbital parameters, they also require information for the gravitational potential of Sgr A*. The G2 data is unable to properly provide the gravitational potential because it has not been observed to have undergone a full orbit around Sgr A* so instead they use the orbit of a nearby star S0-2 which has. Their results suggest that G2 is on a highly eccentric orbit (e=0.9814), will get as close as 130 AU (1900 solar radii) from Sgr A* – closer than previously thought, and will reach its point of closest approach to Sgr A* in March 2014 – a bit later than the previous result of Summer 2013.
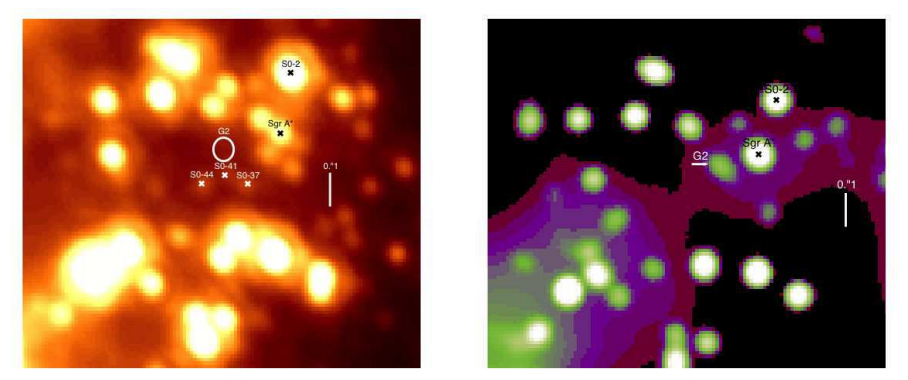
NIRC2 K’ (left) and L’ images of G2 from May 2010 and July 2012, respectively. The white circle represents the OSIRIS position of G2.
So just what is G2? Is it a cloud? Is it a star? Is it a cloud-star? The discovery paper of G2 concluded that G2 is likely a cloud of gas and dust, based on its low temperature (roughly 550 K). In conflict with previous results, the authors in this paper find that the previous claimed “tail” of low surface brightness emission, which lead to the previous conclusion that G2 was a gas cloud, is no longer valid. They find that G2 is a compact source with a gaseous tidal tail, ~100 AU in size, due to its interaction with Sgr A*. Since G2 is compact, it is likely held together by the self-gravity of a star. Furthermore, the high eccentricity may be due to the star being kicked out of a three-body interaction. So how will this be confirmed? By observing G2 when it reaches closest approach to the supermassive black hole. If G2 is a cloud then it will be destroyed. On the other hand, if it is a star then it should remain intact when it passes periapse. So stay tuned!
Author
Trackbacks/Pingbacks