Title: KMOS view of the Galactic centre I: Young stars are centrally concentrated
Authors: Feldmeier-Krause A. et al.
First Author’s Institution: European Southern Observatory (ESO), Garching, Germany

Kaylan Burleigh
This is a guest post by Kaylan Burleigh, a graduate student in astronomy at UC Berkeley. His thesis, with Peter Nugent, is at the intersection of computer science and cosmology; analyzing millions of images of galaxies and quasars to help determine how their distribution in the universe changed over the last 10 billion years. He completed his undergrad at the University of Arizona in May, 2012.
You may have heard that there is a supermassive black hole at the center of our Milky Way Galaxy, named Sgr A* (pronounced “Sagittarius A-star”), but have you heard that more than 100 massive stars orbit Sgr A* incredibly close (within 1 pc)? Check out this time lapse of the stars’ observed motions made by the UCLA Galactic Center group. At 1 pc, Sgr A*’s tidal forces are strong enough to rip apart even the densest star-forming clouds observed elsewhere in the Milky Way so it would be surprising if these stars formed there. How these stars got there remains a key question.
What on Earth’s-nearest-supermassive-black-hole is going on?
Astronomers have suggested two scenarios for getting that many stars that close to Sgr A*: in situ star formation and in-spiral of a star cluster. Kim’s astrobite summarizes these two cases and goes over some star formation basics. In the in situ case, a self-gravitating gas disk orbiting Sgr A* became gravitationally unstable and formed the massive stars where we observe them today. In the in-spiral scenario, a stellar cluster formed far away from Sgr A*, and then fell in due to dynamical friction, leaving 100 massive stars where we find them today and many others further away.
The in situ and in-spiral cases predict different distributions for massive stars around Sgr A*. in situ predicts that the number of massive stars decreases with distance from Sgr A* and quickly drops to zero beyond some critical distance (the outer edge of the accretion disk the stars formed from). The in-spiral scenario predicts that there is a bread-crumb-like trail of stars extending to ever larger distances from Sgr A*. The authors of the paper I discuss today distinguish between these two scenarios by counting the number of stars versus distance from Sgr A*.
Mounting evidence for in situ
The paper’s authors offer additional evidence against the in-spiral scenario. Theoretically, the dynamical friction timescale for a stellar cluster of mass M and distance D to in-spiral to the Milky Way’s center scales as D^2/M. Assuming the largest plausible mass and minimum plausible distance, this timescale is 10x longer than the maximum age of the massive stars: the “paradox of youth”. Observations show a drop in the number of massive stars at 0.5 pc, but the regions observed are asymmetrically distributed around Sgr A* and subject to systematics. The authors confirmed the drop at 0.5 pc by counting the number of massive stars in a symmetric region around Sgr A* extending to well beyond 0.5 pc away.
Results
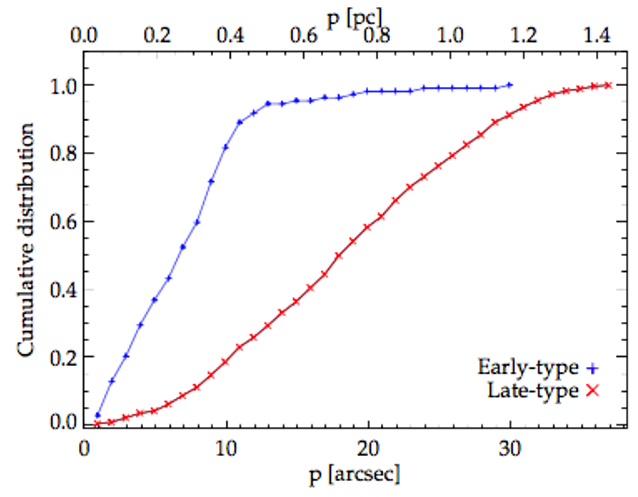
Fig 1: Cumulative probability of finding massive (“early-type”) stars in blue and all other stars (“late-type”) in red as a function of distance from Sgr A*. There is a sharp drop in the number of early-type stars past 0.5 pc. This is why the blue curve flattens out: more than 90% of the massive stars are within 0.5 pc. The blue points only go out to 1.18 pc, not 1.68 pc, because no massive stars are observed past 1.18 pc.
The authors obtained infrared spectra of 1099 stars within 1.68 pc of Sgr A* having sufficiently high signal to noise (S/N > 10) to classify each star as either “early” (massive, 109 out of 1099 stars) or “late” (other, 990) type stars. Every star has a unique spectral fingerprint due to the blend of atoms and molecules in its photosphere. In the infrared, massive stars have strong He, Na, C, and N absorption/emission lines, while all other stars have strong CO absorption lines since their lower surface temperatures permit CO to form.
Figure 1 shows the cumulative probability of finding massive (“early-type”) stars in blue and all other stars (“late-type”) in red versus distance from Sgr A*. Not only is there a sharp drop in the number of early-type stars past 0.5 pc, but of the 109 massive stars detected, only three live beyond 0.5 pc, the farthest being at 1.18 pc. This strongly favors the in situ formation scenario. Another way to visualize this is in Fig. 2, which plots the number density of massive stars (number of stars per radial annulus) versus distance from Sgr A*.
The authors estimate they detect between 50 and 80% of all massive stars in the regions observed, but they do not correct for this in Figs. 1 and 2. Therefore, their data points are lower bounds and could be systematically 20 to 50% higher.
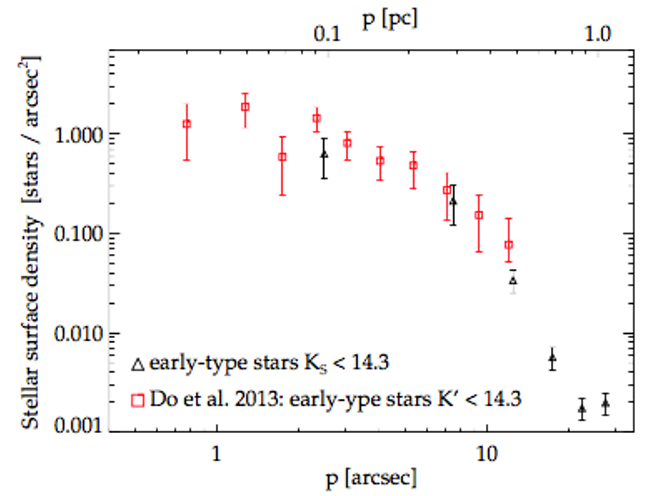
Fig 2: Number density of massive stars (“early-type”) versus distance from Sgr A*. Black points are the authors’ data and red points are from a previous study. If you drew a best-fit line through the red points, then the in-spiral scenario predicts that all points lie near this line. However, the authors’ data are 10 to 100 times lower than this line beyond 0.5 pc.
Take-Home Message
The authors confirmed what previous studies hinted at: the number of massive stars drops beyond 0.5 pc from Sgr A*. They found 106 massive stars between 0.05 and 0.5 pc, three between 0.5 and 1.18 pc, and zero between 1.18 and 1.68 pc. This work adds to the growing evidence that in situ formation explains the massive stars orbiting within 1 pc of Sgr A*.
Breaking news in planet formation
Observations suggest the massive stars formed in situ, but do astronomers have a physical mechanism to explain what happened? Fragmentation of a massive gas disk around Sgr A* is the widely-accepted mechanism, but the details are not yet understood. One promising avenue may be tied to the theory of planet formation. Tim’s very recent astrobite talks about how accretion disks around stars can fragment to form planets closer to the star than previously thought. If this applies to an accretion disk around Sgr A*, in situ formation of massive stars within 1 pc may not be as hard as it seems.
Author
Trackbacks/Pingbacks