Title: Imaging of the CO snow line in a solar nebula analog
Authors: C. Qi, K. I. Oberg, D. J. Wilner, P. d’Alessio, E. Bergin, S. M. Andrews, G. A. Blake, M. R. Hogerheijde, and E. F. van Dishoeck
First Author’s Institution: Harvard-Smithsonian Center for Astrophysics
Qi et al. successfully imaged the CO snow line in the TW Hya protoplanetary disk with ALMA. A snow line is the location in a disk where the temperature drops enough that volatiles condense out of the gas phase and are incorporated into solids. Snow lines play an important role in planet formation. At snow lines, the density of solid mass drastically increases, dust piles up in pressure traps, and grains become stickier as they collect ice on their surfaces. All these factors make it easier to grow grains and planetesimals, the first step in forming planets. There are multiple snow lines in disks that depend on the different boiling point of various molecules. The H2O snow line is discussed most often in the context of giant planet formation, but the CO snow line, farther out in the disk, may affect the bulk composition of planets. The compositional differences of Jupiter and Saturn vs Neptune and Uranus may be because the latter formed beyond the CO snow line, while the other two formed beyond the H2O snow line but not beyond the CO snow line.
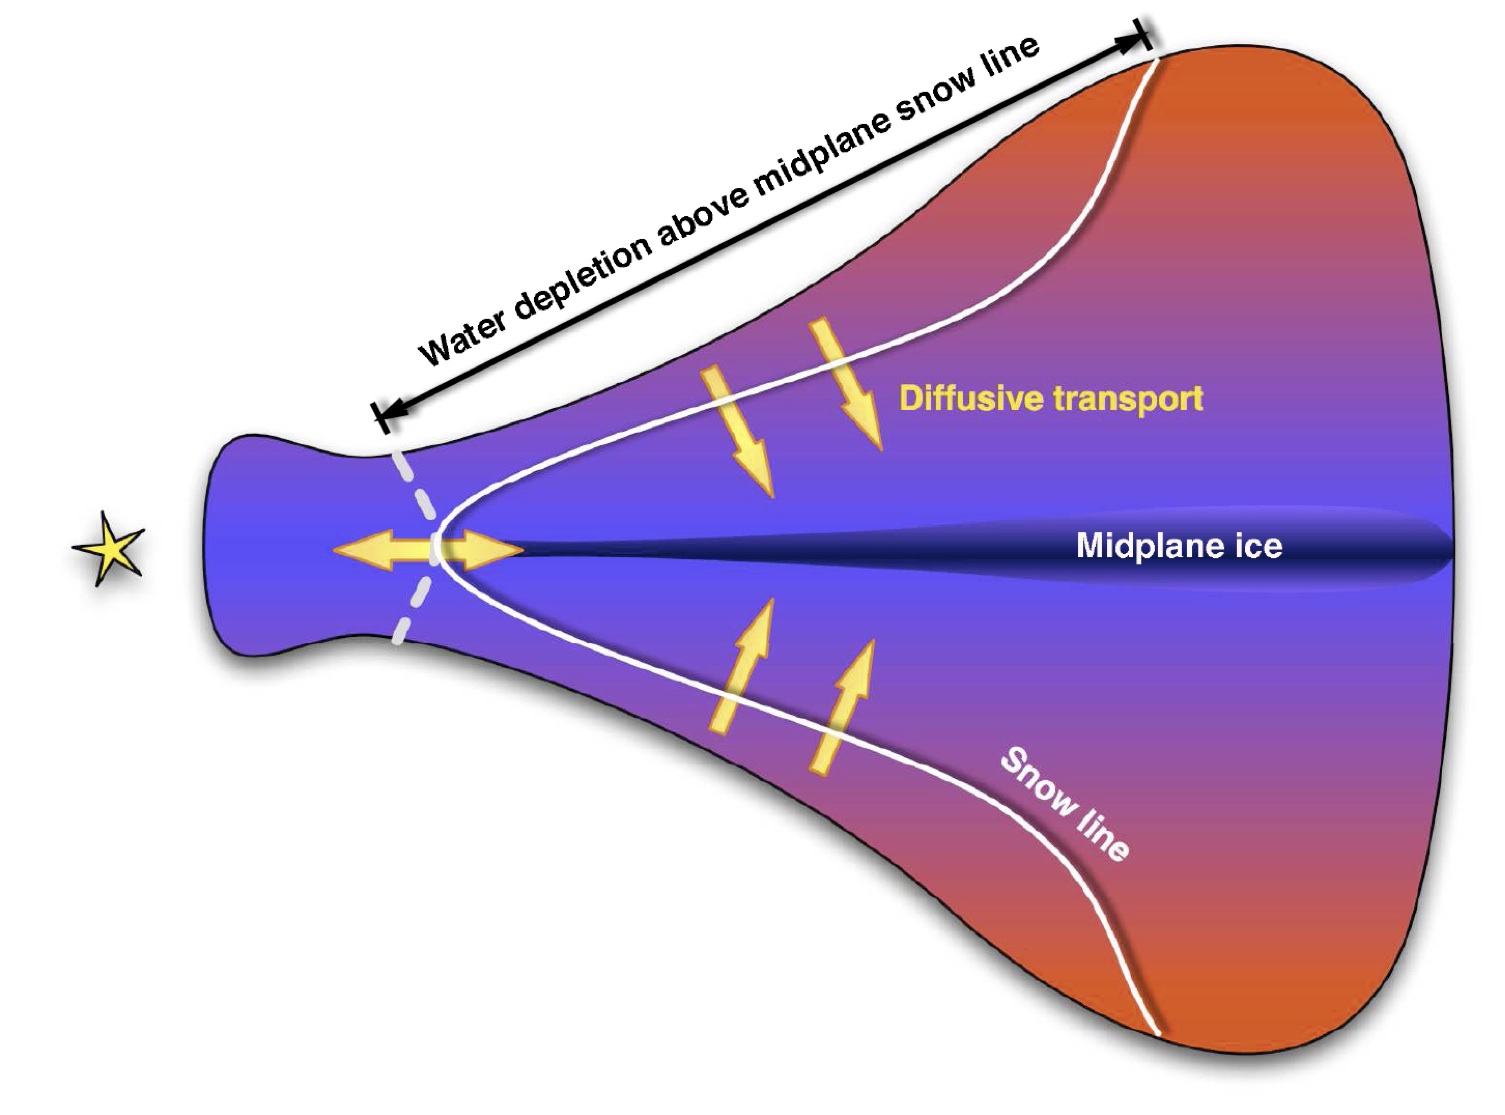
Figure 1 – Illustration of an edge-on cut through a protoplanetary disk. The outer layers of the disk are heated and flared. The temperature in these outer regions is much warmer than the colder mid-plane. Therefore, the snow line further out in the upper layers of the disk.
The CO snow line is hard to determine from CO images of the disk because the location of the snow line changes with disk height. As shown in figure 1, the disk temperature is a function not only of radius, but also of the height above the disk. The projected radius of the snow line changes with height. Only the mid-plane snow line is important for planet formation, but the bulk of the CO emission comes from the surface layers, far beyond the mid-plane snow line. Thankfully, there is another way to measure the CO snow line – with N2H+.
N2H+ gas is only present at locations where CO gas is depleted. This is because the presence of CO gas inhibits the production of N2H+ and promotes its destruction. So N2H+ should only be found outside the mid-plane CO snow line where CO gas has condensed out onto solids. An image of the disk in N2H+ should display a gap in the center where there is too much CO gas for N2H+ to survive, but the N2H+ should be more easily seen in outer portions of the disk.
Qi et al. used the amazing resolving power of ALMA to image the N2H+ in the TW Hya disk. ALMA is a radio interferometer in the Chilean Atacama desert. A radio interferometer collects radio waves from multiple antennas, creating a larger baseline than could ever be achieved with a single antenna. The larger baselines make it easier to resolve smaller structures. Qi et al. used ALMA to take images of the disk in both broadband emission from the dust and narrow line emission from a specific transition of N2H+ gas that is bright at radio wavelengths.
Figure 2 shows the image of the disk. On the left is the continuum emission from the dust, the middle panel shows the CO emission taken with another interferometer, and the rightmost image is the N2H+ emission. This image shows a ring of N2H+ with a clear gap in the center. The inner edge is the approximate location of the CO snow line in the mid-plane.
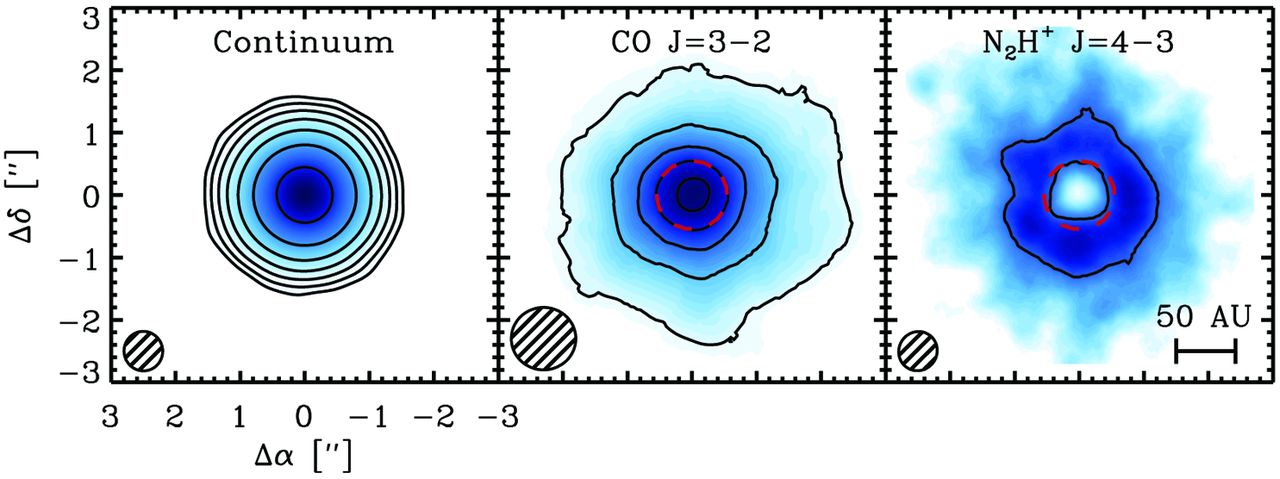
Figure 2 – Radio observation of the TW Hya disk. Left: ALMA continuum image of the dust. Center: CO emission taken with the Sub-Millimter Array. Right: ALMA image of the N2H+ emission. The N2H+ shows a clear gap (inside the red circle) in the same region where the CO emission is strongest.
Author
Trackbacks/Pingbacks