- Title: Photometry and Dynamics of the Minor Merger AM1219-430 with Gemini GMOS-S
- Authors: J.A. Hernandez-Jimenez, M.G. Pastoriza, I. Rodrigues, A.C. Krabbe, Claudia Winge, C. Bonatto
- First Author’s Institution: Federal University of Rio Grande do Sul, Brazil
Collisions and interactions between galaxies are an important part of galaxy evolution. They provide the opportunity to mix gas together, which can set off rapid star formation. These processes also disrupt the morphology, or structure, of the two galaxies. To astronomers, collisions and interactions of galaxies refer to the same thing. When the gravitational tug from one galaxy is enough to disrupt the other one, we consider them to be interacting. Sometimes, these interactions will cause the two galaxies to merge into a single, massive galaxy.
When describing collisions of galaxies, astronomers refer to two types: major mergers and minor mergers. Major mergers are mergers between two galaxies of similar mass. In minor mergers, one galaxy is significantly more massive than the other.
The authors of this paper studied one particular minor merger, called AM 1219-430. Both galaxies in this merger show enhanced star formation, as measured from the equivalent widths, or strength, of multiple absorption lines. Gemini South photometry and spectroscopy were obtained of this system to better understand the interactions taking place.
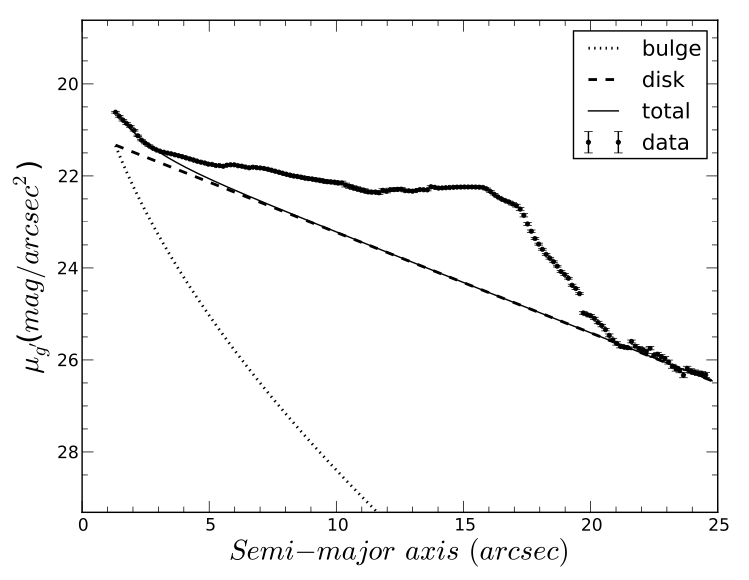
Figure 1: Brightness profile for the more massive galaxy, AM1219A. The bulge and disk components are shown separately, then added together to create the total fit. The actual data shows an excess in the light, indicative of active star formation regions.
Using the images of the galaxies, the authors fit Sersic profiles to quantify the bulge and disk luminosities. Sersic profiles are exponential fits that allow the central intensity and effective radius, which encloses half of the total luminosity, to be measured. Computing the Sersic profiles determines the surface brightness of the galaxies. The surface brightness is a measurement of brightness per area of the sky, so for astronomers this is magnitudes per square arcsecond. Figure 1 shows the results for AM1219A, the more massive galaxy of the pair. The bulge, disk, and total luminosity fits are shown, with the data above those lines. You can see that between ~3 arcseconds and ~21 arcseconds, there is an excess of light compared to what is predicted by the Sersic profiles. This excess is caused by starburst activity happening in the outer arms of the galaxy. Most starburst galaxies have excesses of ~50%, which matches the measurements for this system.
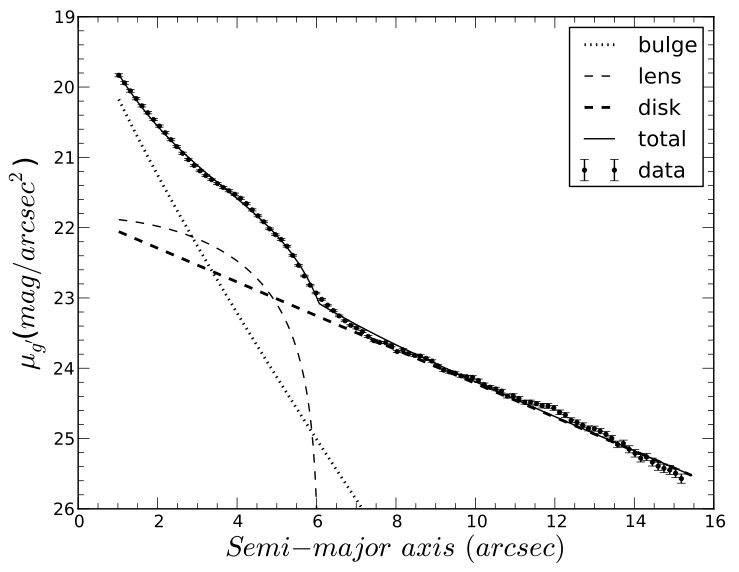
Figure 2: Brightness profile for the less massive galaxy, AM1219B. The bulge, lens, and disk components are shown separately, then summed together to create the total line. Notice how much better the data fits the profile compared to Figure 1.
The Sersic profile for AM1219B, the less massive of the pair, is shown in Figure 2. The profile here reveals the existence of a lens structure in the galaxy. Lens structures are small, central disks that extend just beyond the bulge in the center. Notice how in this profile, the total luminosity matches up with the measured data. From the combined results of both of these profiles, the authors conclude that the merging of these galaxies has not yet affected the disk structures.
The spectra were used to obtain rotation curves for each galaxy. By measuring the location of emission lines, the authors can determine how each side of each galaxy is rotating to investigate any disturbances caused by the collision. Figure 3 shows the result for AM1219A, with the rotation curve on the left and the location of each measurement on the galaxy shown on the right. The South-East side of the galaxy shows a rotation curve that is typical for spiral galaxies. It increases out the galactic center, and then levels off around -3 kpc. We expect the rotation curve of a spiral galaxy to level off because of the presence of dark matter. The North-West side, however, looks very different. It increases quickly, levels off for a little, and then begins to increase again. These high velocities lie in the same region as star-forming H II regions detected through the imaging. This asymmetry in the rotation curve suggests that the motion of the gas has already been disturbed by the interaction with the other galaxy. This type of behavior has been observed in other galaxy minor mergers similar to this one.
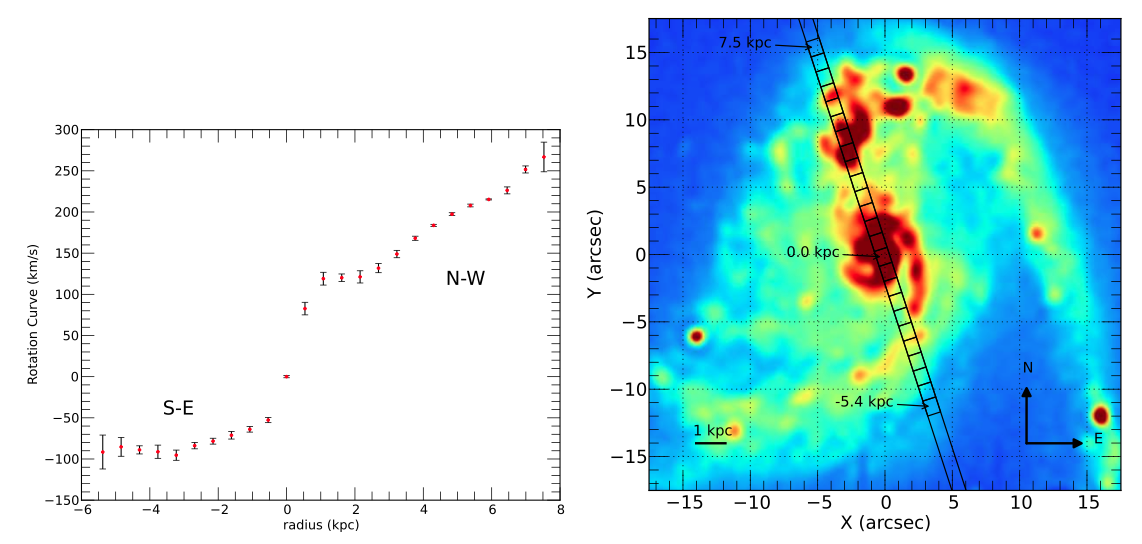
Figure 3: Rotation curve for the more massive galaxy, AM1219A. On the right is shown the location for each of the data points in the plot on the left, in the boxes. The rotation curve on the left shows the asymmetry caused by the interaction with the other galaxy.
Having both the surface brightness profiles and the rotation curves allowed the authors to determine the dark matter distribution in this system of galaxies.The authors estimate there is 10 times as much dark matter mass as there is mass from stars and gas. This significantly affects how the two galaxies interact. In turn, these data allows models of galactic collisions to be tested against actual data. Next, the authors plan to model this interaction numerically, using the results of this paper to inform that work.
Author