- Title: Inference of Inhomogeneous Clouds in an Exoplanet Atmosphere
- Authors: Brice-Olivier Demory (MIT), Julien de Wit (MIT), Nikole Lewis (MIT), Jonathan Fortney (UCSC), Andras Zsom (MIT), Sara Seager (MIT), Heather Knutson (Caltech), Kevin Heng (U. Bern), Nikku Madhusudhan (Yale), Michael Gillon (U. Liege), Thomas Barclay (NASA Ames), Jean-Michel Desert (Caltech), Vivien Parmentier (Nice/OCA), Nicolas B. Cowan (Northwestern)
- First Author’s Institution: Department of Earth, Atmospheric and Planetary Science, Massachusetts Institute of Technology, Cambridge, MA
An international team of astronomers have used data from NASA’s Kepler and Spitzer space telescopes to create the first map of clouds on an exoplanet.
Kepler 7b, a sizzling hot Jupiter, is marked by high clouds in the west and clear skies in the east. While previous studies from the Spitzer Space Telescope have resulted in temperature maps of a few exoplanets, this is the first cloud map.
Most hot Jupiters are dark at visible wavelengths, meaning that they have little to no appreciable albedo, or reflectivity. They simply absorb most incident starlight, reflecting little in return.
Remarkably, Kepler 7b has the highest exoplanet albedo yet recorded. Ranking in at 0.35, it reflects approximately 35% of its incident starlight. Such a high albedo has recently been attributed to the presence of a cloud or haze layer in its atmosphere.
In order to test this hypothesis, Dr. Brice-Olivier Demory, of MIT, and coauthors, first analyzed data taken by the Kepler Space Telescope. While Kepler’s problematic reaction wheels prevent it from currently hunting planets, there are still 1,200 days of quasi-continuous observations in archived data. In this case, Demory et al. had 56,000 total data points to work with.
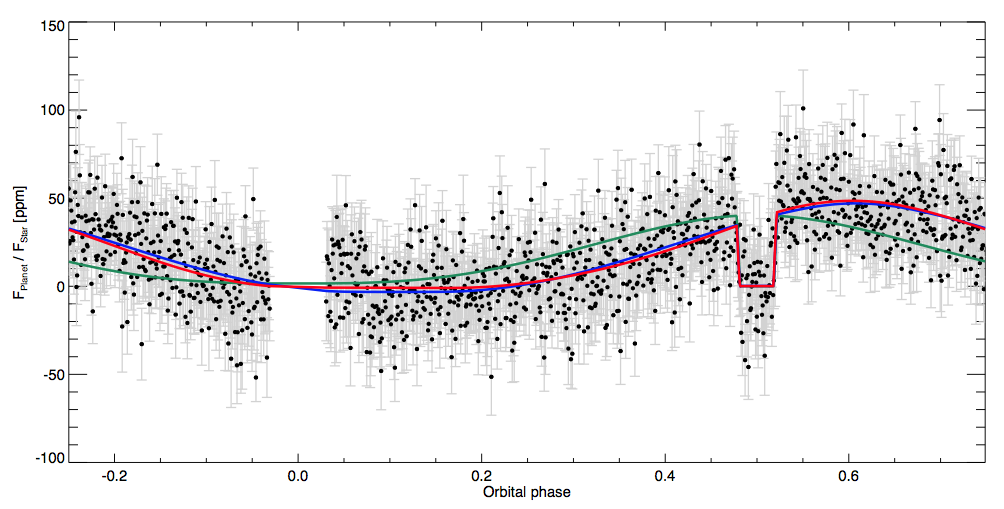
Fig. 1 – The phase curve of Kepler 7b, extracted from nearly four years of Kepler data. The phase curve’s minimum is at a phase of 0.18, while the phase curve’s maximum is at a phase of 0.61.
Kepler 7b’s extracted phase curve (as can be seen in figure 1) shows the overall light from the system throughout its entire orbit around its host star. Unlike a transit light curve, which is only measuring the eclipse depth as compared to a continuum, a phase curve preserves the change in brightness of the planet over the entire orbit. Take, for example, a phase curve of the moon orbiting the Earth. One would see a minimum in the phase curve at new moon (during primary transit), followed by a rise in light, until a maximum at full moon (during secondary transit).
The ideal phase curve shows the minimum amount of light due to a new phase at a phase of 0, and a maximum amount of light due to a full phase at a phase of 0.5. Here 0.5 also represents the substellar point – the location on a planet where the star appears to be at noon – making it extremely hot. Because most hot Jupiters are tidally locked to their host stars, this represents a physical time and place.
Kepler 7b’s phase curve, however, is far from ideal. It’s minimum is placed at a phase of 0.18, when the meridian centered 25 degrees east of the substellar point appears. And it’s maximum is placed at a phase of 0.61, implying that the brightest point is centered on the meridian located 41 degrees west of the substellar point.
But these data alone were not enough to decipher whether the bright spot was coming from clouds or heat. If the bright spot is coming from heat, there will be detectable thermal emission as well.
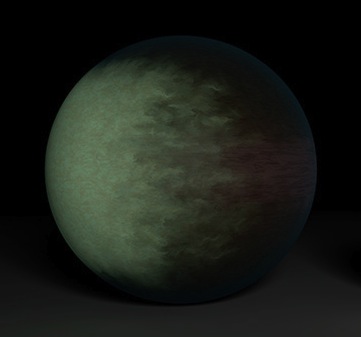
Fig. 2 – an artist’s conception of the cloud map generated for Kepler 7b. Image Credit: NASA/JPL-Caltech/MIT
This led the team to perform follow-up observations. They observed two occultations with Spitzer – an infrared telescope that allowed them to measure temperature. The first observation looked at 3.6 micron infrared light, while the second observation looked at 4.5 micron infrared light.
At 3.6 microns, Kepler 7b’s temperature is 1700 K, while at 4.5 microns, it’s temperature is 1840 K. This range is relatively cool for a planet that orbits within 0.06 AU from its host star.
Demory et al. therefore conclude that Kepler 7b is too cool for its hot spot to be explained via thermal radiation. Instead, incident light from the host star is bouncing off cloud tops located on the west side of the planet. The east side of the planet remains clear of clouds. But due to heavy winds the brightest spot appears 41 degrees west of the substellar point.
With these results, the team was able to generate a rough map of the clouds in Kepler 7b’s upper atmosphere.
Author
Trackbacks/Pingbacks