Title: Supervised Learning Detection of Sixty Non-Transiting Hot Jupiter Candidates
Authors: Sarah Millholland, Greg Laughlin
First Author’s Institution: Yale University
Status: Accepted in AJ [open access]
When NASA’s Kepler Mission brought the transit method’s prospects for detecting an immense amount of planets in other star systems to fruition, it also brought a wondrous joyful feeling into the hearts and minds of astronomers and ordinary people who had long been dying to know if there were other planets out there and what they would look like. With that joy, however, comes the torment of knowing that most exoplanets do not transit their stars, leaving us to wonder if many of the stars still thought to be barren actually harbor planets.
In today’s paper, Sarah Millholland and Greg Laughlin attempt to alleviate some of that pain by searching over 140,000 of Kepler’s transit-less light curves for missing exoplanets that hopefully leave a different type of signature. When planets transit their stars, they block a small amount of light – typically about 1% for a moderately-sized planet that is not too far away, just enough for us to be able to see it happen. Can planets that do not transit also alter the amount of light coming their star system?
Fortunately, they do. Just as a star shines its own light, planets also shine the light they reflect from their stars. When a planet’s dayside is facing us, it emits noticeably more light than when we are looking at its nightside (see Figure 1). This drop is at most 0.01% — or 100 times smaller than a transit — for the largest planets closest to their stars, namely Hot Jupiters. Although such a small variation is much more difficult to see (especially with the threat of noise getting in the away), today’s authors attempt to detect it.
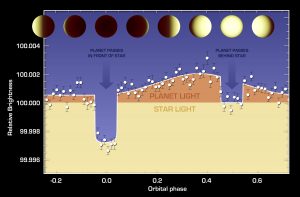
Figure 1. Example light curve for a transiting planet. The non-transiting part is called a phase curve. Even if the planet did not transit, it could still potentially be detected from the variations in “planet light” (orange) due to its different “moon-like” phases. Credit: NASA/JPL-Caltech/Univ. of Cambridge
In order to know what the planet’s light looks like (even when it is hidden by noise), Millholland and Laughlin simulate 10,000 light curves – half of which have synthetic planets that never transit and a variety of noise sources, and half of which just have noise. They then attempt to detect these fake planets using machine learning. Once they are successful with that, they use their method on real Kepler light curves.
Intro to Machine Learning
The authors want to teach a computer what a “phase curve” – a light curve with a sinusoidal variation from the phases of a non-transiting planet – looks like. They can do this by supervising the computer – that is, giving it a ton of examples of synthetic light curves, and then telling it which have planets and which do not. Taking advantage of the large sample, the computer can then figure out which characteristics of a light curve best indicate the presence of a planet and which best indicate there is no planet. To make this easier for the computer to learn, the authors also tell the computer which features of the light curve are important indicators of whether or not there is a planet.
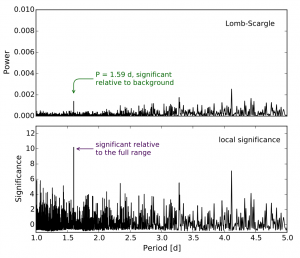
Figure 2. Top: Periodogram of a Light Curve, which shows the strengths of a range of signal periods. Bottom: Same as the top, except normalized to the median signal strength for periods +/- 0.25 days. In this light curve, there is a planet with a 1.59 day period, but it only appears as the strongest signal when looking at the local significance. Fig. 1 from the paper.
They choose 12 features in total. Some of these features (like the amplitude and period of the planet’s signal) are properties of the planet itself that are measured from the light curve. (If there is no planet, these features should not be self-consistent.) Other features measure the reliability of those measured planet properties. For example, this includes the strength of the signal period relative to nearby period strengths (see the local significance in Figure 2). The last set of features measure how well a two-component (star + planet) fit to the light curve works compared to a one-component fit (just the star).
The authors then partition their dataset (of 10,000 synthetic light curves) and use 95% of those light curves to train a classifier to learn how to predict whether a given light curve has a planet (and with what probability) based on the values of its 12 features. They then test the accuracy of the classifier by having it predict whether each of the remaining 5% of the light curves has a planet.
Millholland and Laughlin find that their classifier works very well! It can correctly predict whether a light curve has a planet about 90% of the time. Even better, the classifier is nearly perfect in cases where it gives a probability of at least 0.90 that its prediction is correct.
To validate how well their classifier works, the authors train and test 5,000 more classifiers, each one with a different random 95%-5% partition of their data. They find that the median prediction accuracy is an impressive 98% (see Figure 3) when the classifier gives a 0.90 probability or higher that it is correct. Keeping this in mind, they move on to real light curves.
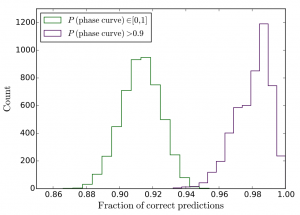
Figure 3. Prediction accuracy of each of the 5000 classifiers. The median accuracy on the entire test set was 91% (green). In cases where the classifier predicted it would be correct 90% of the time, it was correct 98% of the time on average (purple)! Fig. 10 from the paper.
Finding Real Non-Transiting Hot Jupiters
The authors use their classifier on 142,630 Kepler light curves and find a small fraction that are predicted to have non-transiting planets. They further reduce the size of this group of planet candidates by (1) only considering light curves where the classifier gives a probability of 0.97 or higher that there is a planet. They then use additional checks to get rid of (2) candidates that may be companion star imposters instead of companion planets, as well as (3) candidates with non-physical parameters such as a bizarre combination of mass and radius compared to known planets. After these three filters, Millholland and Laughlin are left with a set of 60 new non-transiting Hot Jupiter candidates that are very likely to be real!
To follow up on these candidates, they hope that future studies will be able to use the radial velocity method to confirm these candidates as real planets. If these planets are real, their phase curves could also potentially be used to study their atmospheres, just like with Kepler-7b. Additionally, the authors hope to combine this method of studying phase curves with transit timing variations (TTVs) to discover non-transiting Hot Jupiters in systems already known to have planets orbiting further away from their stars.

Trackbacks/Pingbacks