Title: Evidence for Two Hot Jupiter Formation Paths
Authors: Benjamin E. Nelson, Eric B. Ford, and Frederic A. Rasio
First Author’s Institution: Center for Interdisciplinary Exploration and Research in Astrophysics (CIERA) and Department of Physics and Astronomy, Northwestern University, IL, USA; Northwestern Institute for Complex Systems, IL, USA
Status: Submitted to AJ, open access
Frolicking through fields of data
The future of astronomy observations seems as bright as the night sky… and just as crowded! Over the next decade, several truly powerful telescopes are set to launch (read about a good number of them here and also here). That means we’re going to have a LOT of data on everything from black holes to galaxies, and beyond – and that’s in addition to the huge fields of data from the past decade that we’re already frolicking through now. It’s certainly far more data than any one astronomer (or even a group of astronomers) wants to analyze one-by-one – that’s why these days, astronomers turn more and more to the power of astrostatistics to characterize their data.
The author’s of today’s astrobite had that goal in mind. They explored a widely-applicable, data-driven statistical method for distinguishing different populations in a sample of data. In a sentence, they took a large sample of hot Jupiters and used this technique to try and separate out different populations of hot Jupiters, based on how the planets were formed, within their sample. Let’s break down exactly what they did, and how they did it, in the next few sections!
Hot Jupiters are pretty cool
First question: what’s a hot Jupiter, anyway?
They’re actually surprisingly well-named: essentially, they are gas giant planets like Jupiter, but are much, much hotter. (Read all about them in previous astrobites, like this one and this other one!) Hot Jupiters orbit perilously close to their host stars – closer even than Mercury does in our own Solar System, for example. But it seems they don’t start out there. It’s more likely that these hot Jupiters formed out at several AU from their host stars, and then migrated inward into the much closer orbits from there.

Figure 1: A gorgeous artist’s impression of a hot Jupiter orbiting around its host star. Image credit goes to ESO/L. Calçada.
As to why hot Jupiters migrate inward… well, it’s still unclear. Today’s authors focused on two migration pathways that could lead to two distinct populations of hot Jupiters in their sample. These migration theories, as well as what the minimum allowed distance to the host star (the famous Roche separation distance, aRoche) would be in each case, are as follows:
- Disk migration: hot Jupiters interact with their surrounding protoplanetary disk, and these interactions push their orbits inward. In this context, aRoche corresponds to the minimum distance that a hot Jupiter could orbit before its host star either (1) stripped away all of the planet’s gas or (2) ripped the planet apart.
- Eccentric migration: hot Jupiters start out on very eccentric (as in, more elliptical than circular) orbits, and eventually their orbits morph into circular orbits of distance 2aRoche. In this context, aRoche refers to the minimum distance that a hot Jupiter could orbit before the host star pulled away too much mass from the planet.
The authors defined a parameter ‘x’ for a given hot Jupiter to be x = a/aRoche, where ‘a’ is the planet’s observed semi-major axis. Based on the minimum distances in the above theories, we could predict that hot Jupiters that underwent disk migration would have a minimum x value of x = aRoche/aRoche = 1. On the other hand, hot Jupiters that underwent eccentric migration would instead have a minimum x value of x = 2aRoche/aRoche = 2. This x for a given planet is proportional to the planet’s orbital period ‘P’, its radius ‘R’, and its mass ‘M’ in the following way:
x = a/aRoche \(\propto\) (P\(^{2/3}\))(M\(^{1/3}\))/R
And this x served as a key parameter in the authors’ statistical models!
Toying with Bayesian statistics
Next question: how did today’s authors statistically model their data?
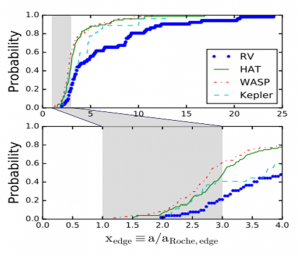
Figure 2: Probability distribution of x for each observation group, assuming that each hot Jupiter orbit was observed along the edge (like looking at the thin edge of a DVD). The bottom panel zooms in on the top one. Note how the samples have different minimum values! From Figure 1 in the paper.
Short answer: with Bayesian statistics. Basically, the authors modeled how the parameter x is distributed within their planet sample with truncated power laws – so, x raised to some power, cutoff between minimum and maximum x values. They split their sample of planets into two groups, based on the telescope and technique used to observe the planets: “RV+Kepler” and “HAT+WASP”. Figure 2 displays the distribution of x for each of the subgroups.
The authors then used the Markov Chain Monte Carlo method (aka, MCMC; see the Bayesian statistics link above!) to explore what sort of values of the power laws’ powers and cutoffs would well represent their data. Based on their chosen model form, they found that the RV+Kepler sample fit well with their model relating to eccentric migration. On the other hand, they found evidence that the HAT+WASP sample could be split into two populations: about 15% of those planets corresponded to disk migration, while the other 85% or so corresponded to eccentric migration.
Remember that a major goal of today’s authors was to see if they could use this statistical approach to distinguish between planet populations in their sample… and in that endeavor, they were successful! The authors were thus optimistic about using this statistical technique for a much larger sample of hot Jupiters in the future, as oodles of data stream in from telescopes and surveys like KELT, TESS, and WFIRST over the next couple of decades.
Their success joins the swelling toolbox of astrostatistics… and just in time! Telescopes of the present and very-near future are going to flood our computers with data – so unless we’re willing to examine every bright spot we observe in the sky by hand, we’ll need all the help from statistics that we can get!
Author