- Title: Carbon monoxide intensity mapping at moderate redshifts
- Authors: Patrick C. Breysse, Ely D. Kovetz and Marc Kamionkowski.
- First author’s institution: Johns Hopkins University, Baltimore, USA.
- Status: submitted to MNRAS.
Galaxies are like beacons of light in the midst of a cosmic web of gas. In this paper, the authors discuss how to create maps of the galaxies in the Universe by looking at light emitted with a specific energy: that of a carbon monoxide molecule in a star forming region decaying from its first rotationally excited state, CO(1-0). This technique should allow us to map a relatively unexplored epoch of the Universe.
Carbon monoxide is abundant in star forming regions. It is also very easy to detect because little energy is needed to excite it (remember this astrobite). When the excited state decays back to a lower energy level, it emits a photon in the microwave region of the electromagnetic spectrum. The idea behind this paper is that by looking for this emission, astronomers could create maps of the distribution of star forming galaxies. Because star formation in the Universe as a whole peaks around redshift of 3, when the Universe was approximately 2.2 billion years old, the authors study the feasibility of the proposed CO intensity mapping for galaxies at those redshifts.
To determine whether this experiment is possible, the authors first have to build a model that can predict how much CO emission is expected from star forming galaxies at redshift of 3. The details of the modelling depend on how one relates the intensity of the CO emission expected to the amount of star formation in a galaxy, and to the galaxy’s mass. For example, in the simplest model considered, the CO intensity depends on the rate at which a galaxy forms stars with a normalization fixed by using observations of Messier 82, a nearby starburst galaxy. The authors also assume that this rate is proportional to the mass of a galaxy (as long as the galaxy has a mass above a certain mass threshold) and that galaxies above the threshold are not constantly emitting, they only turn on during a period of time (for example, after a merger with another galaxy). For comparison, they also consider a few other models within the possibilities allowed by current theoretical understanding and observational evidence.
Galaxies live in a structure of walls, voids, filaments and knots of dark matter. Each galaxy is embedded within a dark matter halo. Even with this model at hand, it is impossible to make a predictive map of the CO emission of star forming galaxies as viewed from Earth. However, the model can predict how galaxies cluster, i.e., their relative separations. For example, it is known that massive galaxies have a mean separation that is smaller (they are more clustered) than less massive ones. This is the result of gravity acting to pull them together over billions of years throughout the history of the Universe. Studying this clustering, we gain knowledge of the components and the evolution of the Universe.
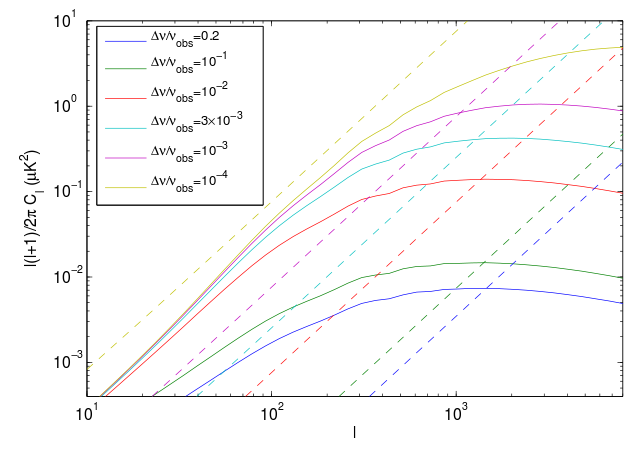
The clustering function of CO emitting galaxies (solid lines) for experiments with different bandwidths (corresponding to the different colors). The dashed lines represent the noise in the measurement. A smaller bandwidth corresponds to a thinner shell in terms of distance to the CO emitters, which also corresponds to increasing noise. A thinner shell also has larger clustering, because of projection effects across the shell. Figure 1 from Breysse et al.
In the figure to the left, the authors plot a function that represents the clustering of CO emitting star forming galaxies at a redshift of 3. The x-axis represents angular separation between galaxies. The smaller l is, the larger the angular scale. As time evolves in the Universe, matter becomes more clustered and the peak at high-l grows in correspondence with galaxies being pulled together by gravity. The different colors correspond to experiments that would observe the CO line with different bandwidths. The dashed lines correspond to the noise in the measurement. There is a trade-off between signal and noise as the bandwidth changes.
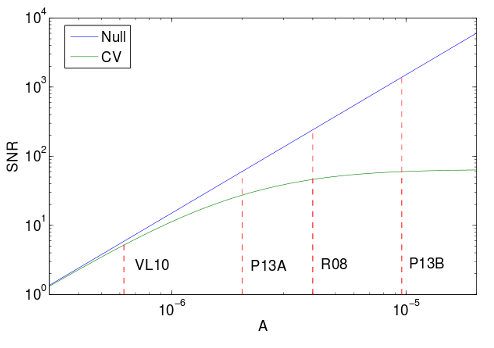
The dependence of the signal-to-noise ratio of the proposed survey on the details of the CO emission model. The x-axis parametrizes the different models adopted. The blue line is the signal-to-noise for detection of the signal, while green includes the attempt to extract information about the properties of the Universe from it. Figure 5 from Breysse et al.
Finally, the authors demonstrate the feasibility of this proposed study by showing the signal-to-noise ratio we should expect from currently planned experiments that will look for CO emitters at redshift of 3. The figure below shows the dependence of the signal-to-noise on the assumptions made in the models for CO emission and star formation (VL10,P13A,R08,P13B). This signal-to-noise ratio tells us how well we can measure the signal (blue), but this is not enough: if we want to extract information about our Universe from it, we need to take into account that we are probing a limited volume of our one and only observable Universe (green). In other words, the signal measured could change depending on the region we are observing. Despite wide variation in the prediction from the different models, in most cases the signal could be clearly detected. In the case of the VL10 model, the signal-to-noise is much lower (SNR < 6) than in the other models, and the signal would be difficult to detect.
Overall, the authors show that, except in the case of the most pessimistic model, CO mapping is promising for mapping of the three dimensional structure of the Universe during a relatively unexplored epoch. As a result of this study, the authors are also able to recommend survey strategies that will allow for better measurement of this signal. However, many theoretical uncertainties remain and better models could improve our interpretation of future observations. Stay tuned!
Author